MPC5553/MPC5554 Microcontroller Reference Manual, Rev. 5
19-114 Freescale Semiconductor
Table 19-58 shows, for this particular case, examples of how the result values change according to GCC
and OCC when result calibration is executed (CAL=1) and when it is not (CAL=0).
19.5.6.3 Quantization Error Reduction During Calibration
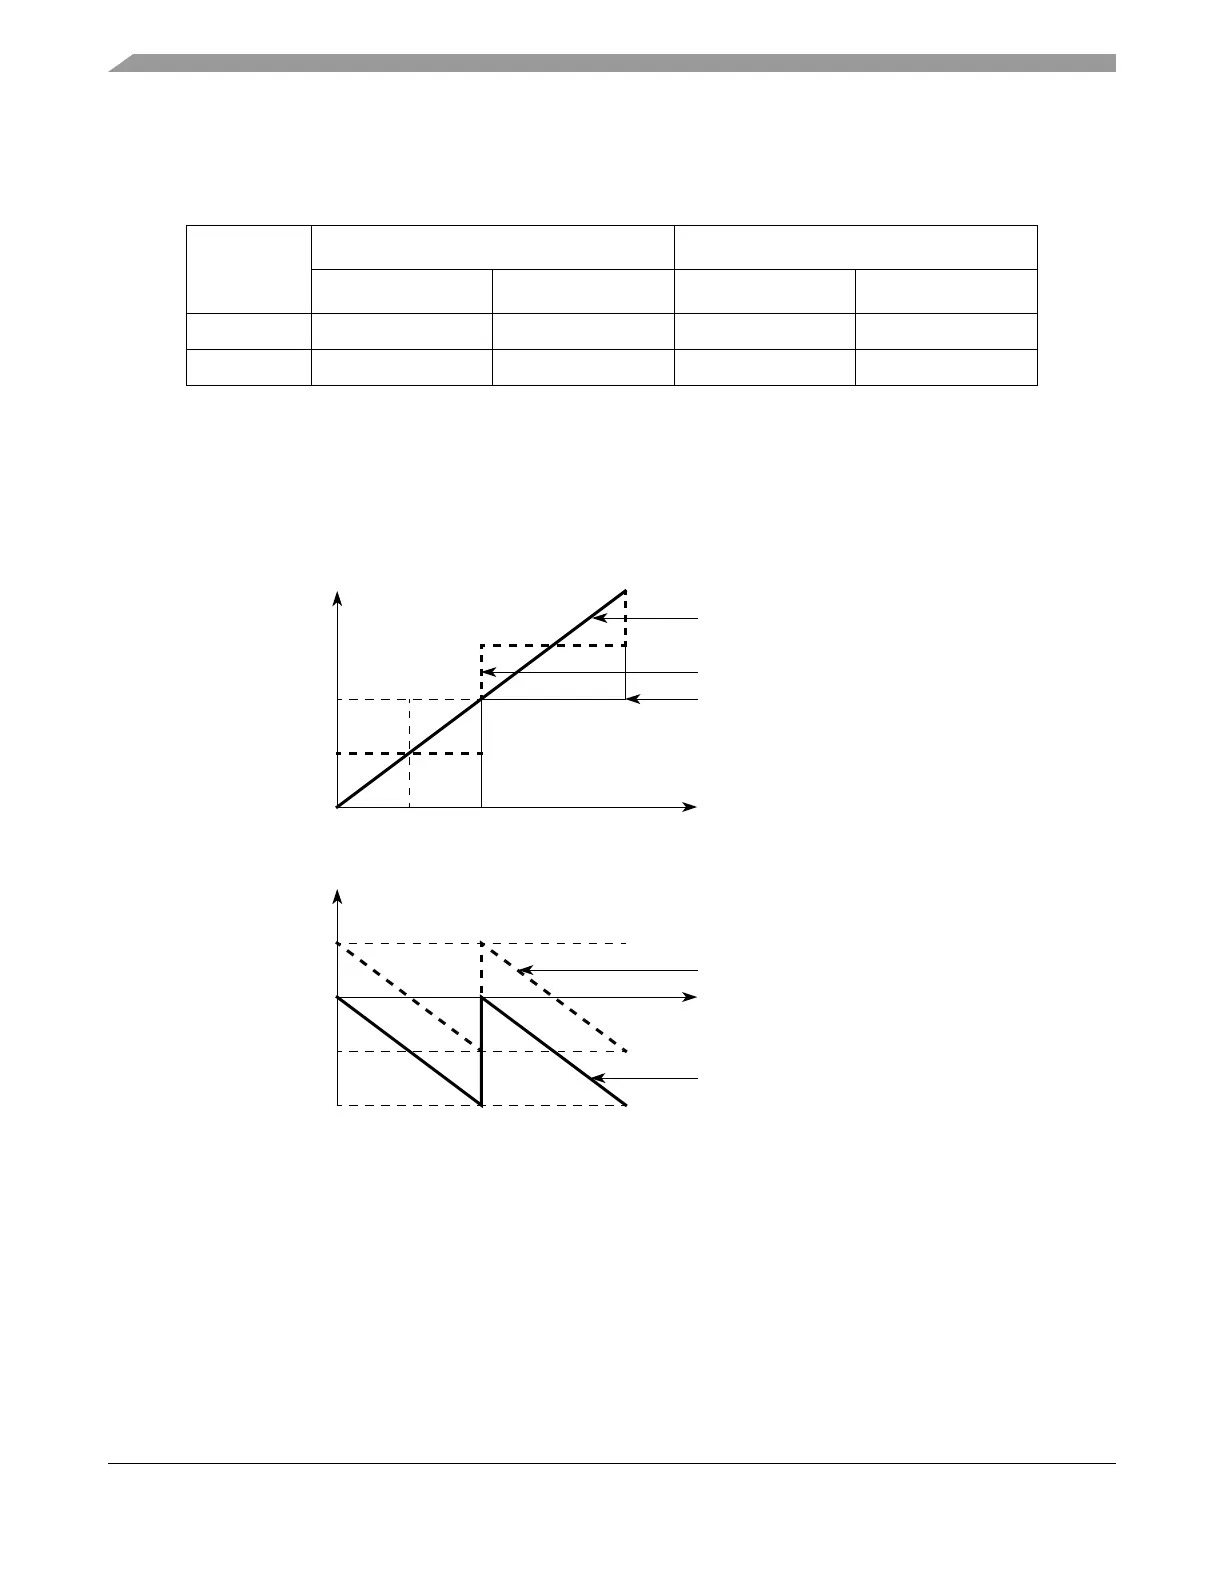
Figure 19-68 shows how the ADC transfer curve changes due to the addition of two to the MAC output
during the calibration - see MAC output equation in Section 19.4.5.4, “ADC Calibration Feature”. The
maximum absolute quantization error is reduced by half leading to an increase in accuracy.
Figure 19-68. Quantization Error Reduction During Calibration
19.5.7 eQADC versus QADC
This section describes how the eQADC upgrades the QADC functionality. The section also provides a
comparison between the eQADC and QADC in terms of their functionality. This section targets users
familiar with terminology in QADC. Figure 19-69 is an overview of a QADC. Figure 19-70 is an overview
of the eQADC system.
Table 19-58. Calibration Example
Input Voltage
Raw result (CAL=0) Calibrated result (CAL=1)
Hexadecimal Decimal Hexadecimal Decimal
25% VREF 0x0ED6 3798 0x1000 4095.794
75% VREF 0x2D48 11592 0x3000 12287.486
4
Ideal Transfer Curve
0
Shifted Transfer Curve
ADC Transfer Curve
Input Voltage
(12-bit A/D Resolution)
Digital Value
(14-bit Result)
1/2
lsb
lsb
0
–4
Error for Shifted Transfer Curve
Input Voltage
(12-bit A/D Resolution)
Quantization Error
1/2
lsb
lsb
Error for ADC Transfer Curve
2
–2