10 Monitor Spectrum Measurement
Meas
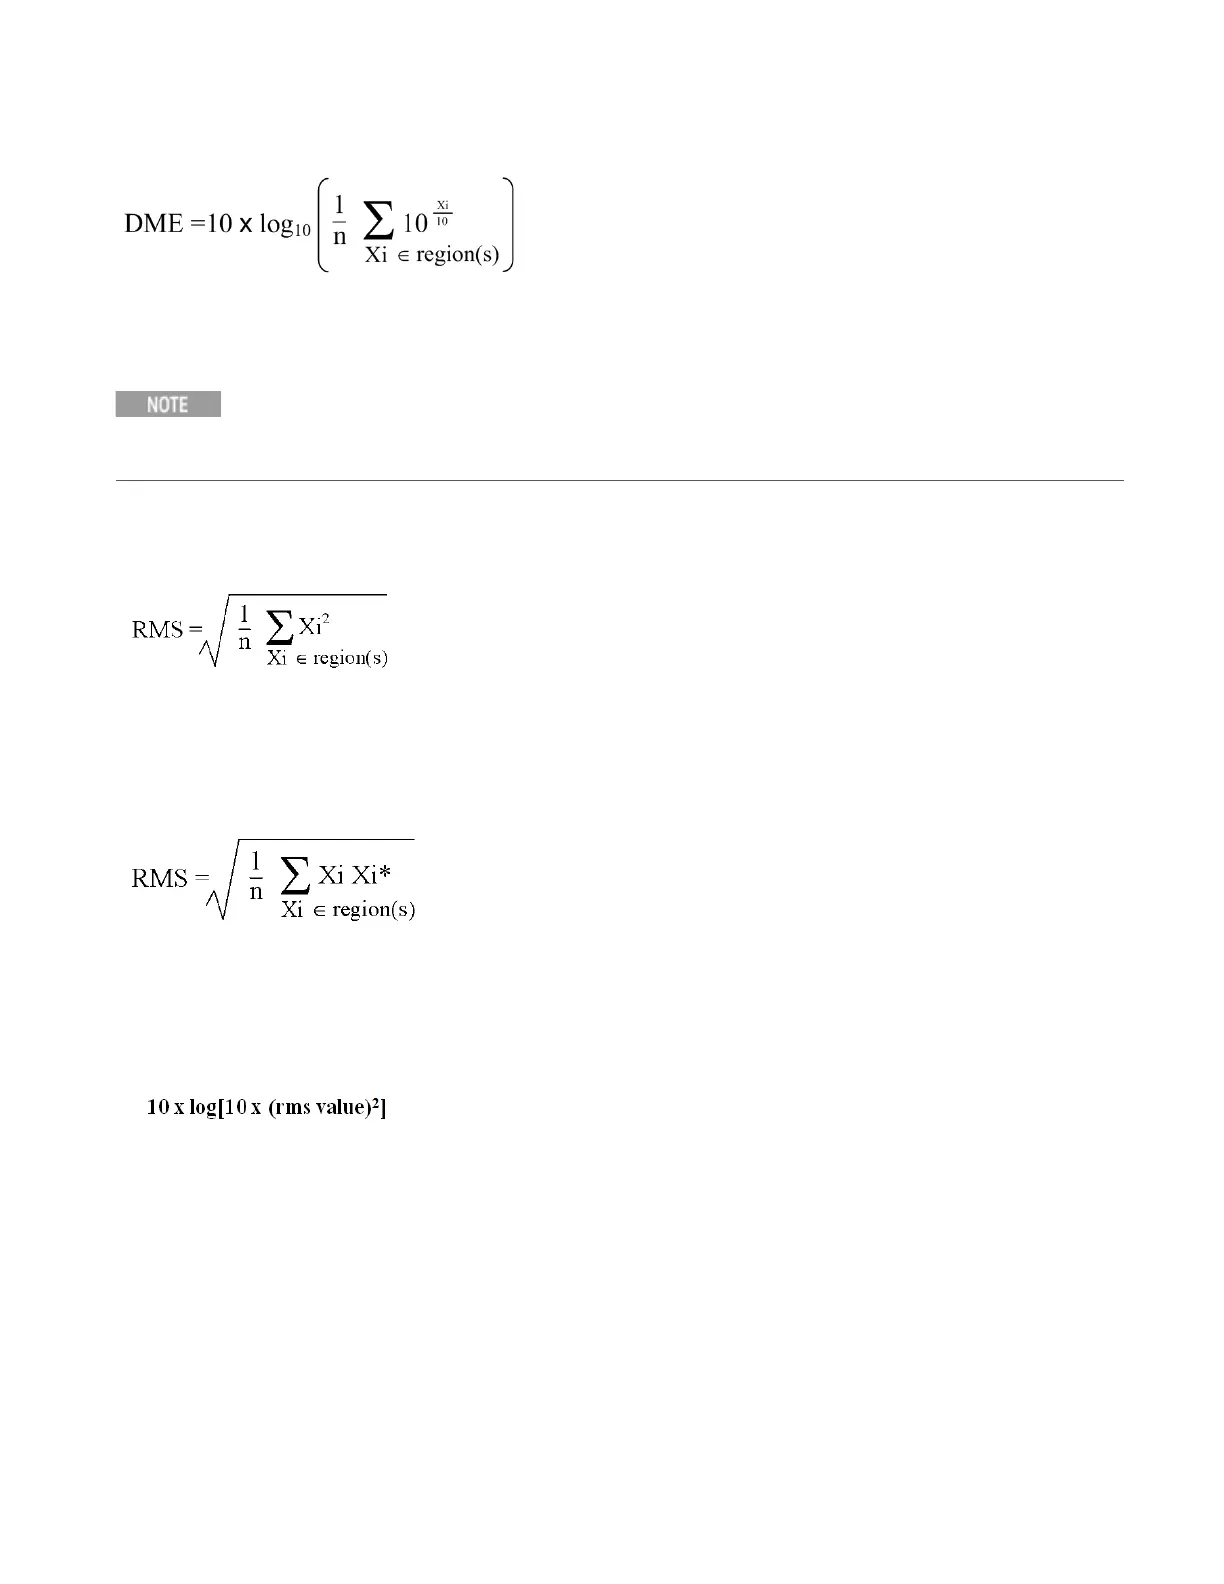
• RMS - returns a single value that is the average power on a root-mean-squared voltage scale
(arithmetic rms) of the data point values for the specified region(s) of trace data. See the following
equation.
For I/Q trace data, the rms of the magnitudes of the I/Q pairs is returned. See the following equation.
This function is very useful for I/Q trace data. However, if the original trace data is in dB, this function
returns the rms of the log values which is not usually needed.
Equation 4
RMS Value of Data Points for Specified Region(s)
where Xi is a data point value, and n is the number of data points in the specified region(s).
Equation 5
RMS Value of I/Q Data Pairs for Specified Region(s)
where Xi is the complex value representation of an I/Q pair, Xi* its conjugate complex number, and n is
the number of I/Q pairs in the specified region(s).
Once you have the rms value for a region of trace data (linear or I/Q), you may want to calculate the
mean power. You must convert this rms value (peak volts) to power indBm:
• SAMPle - returns the first data value (x,y pair) for the specified region(s) of trace data. For I/Q trace data,
the first I/Q pair is returned.
• SDEViation - returns a single value that is the arithmetic standard deviation for the data point values for
the specified region(s) of trace data. See the following equation.
• For I/Q trace data, the standard deviation of the magnitudes of the I/Q pairs is returned. See the
following equation.
Equation 6
Standard Deviation of Data Point Values for Specified Region(s)
EMI Receiver Mode Reference 773

 Loading...