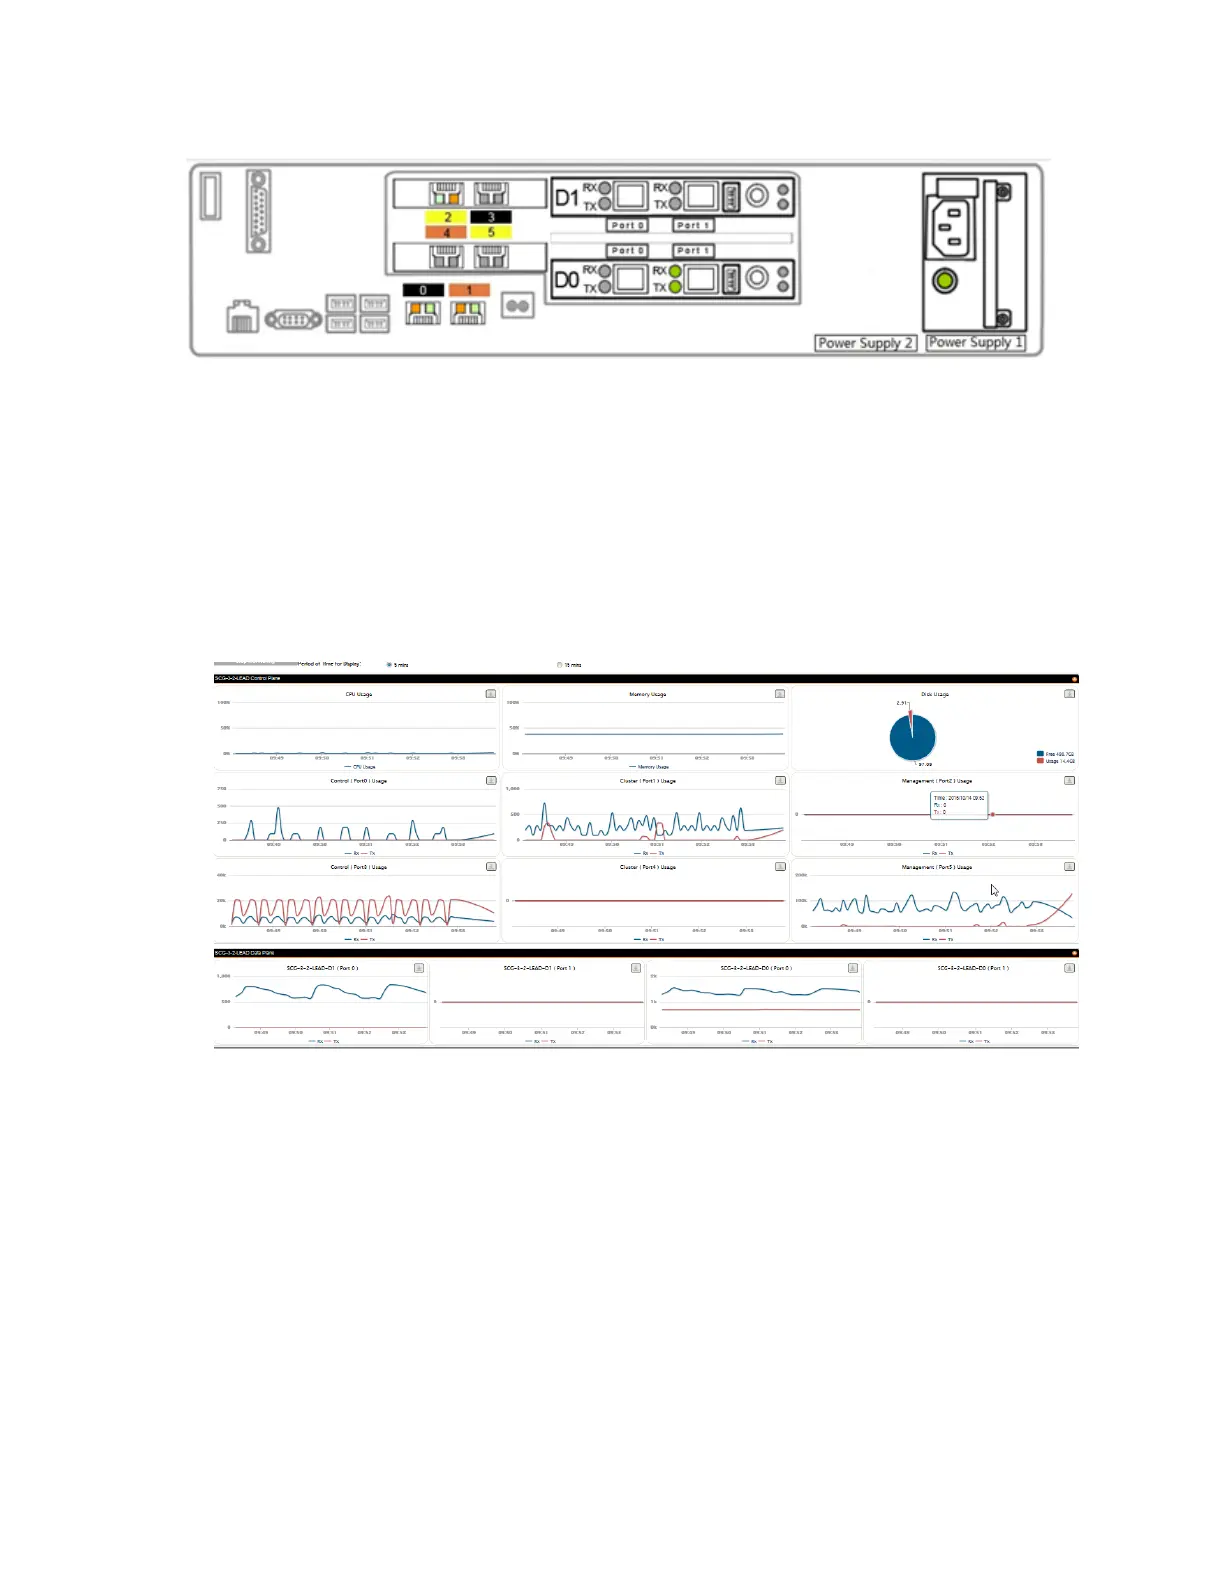
Figure 167: The chassis view page displaying the chassis of all nodes in the cluster
Starting the Cluster Real-time Monitor
The Cluster Real-time Monitor displays graphs and charts of the controller system resources.
Use this monitor to understand how system resources on the cluster nodes are being used.
1. To start the cluster real-time monitor, click Start Cluster Real-time Monitor on the System
Cluster Overview page.
A new browser page or tab appears (depending on your browser settings), and then the
Cluster Real-time Monitor page appears.
Figure 168: The Cluster Real-time Monitor page
The resource graphs and charts that are shown on the Cluster Real-time Monitor page
include:
• CPU Usage
• Memory Usage
• Disk Usage
• Control Tx (Port0, Port 3)
• Cluster Tx (Port1, Port 4)
• Management Tx (Port2, Port 5)
• Control Rx (Port0, Port 3)
• Cluster Rx (Port1, Port 4)
SmartCell Gateway 200/Virtual SmartZone High-Scale for Release 3.4.1 Administrator Guide
302
Monitoring the System, Alarms, Events, and Administrator Activity
Monitoring the Controller System