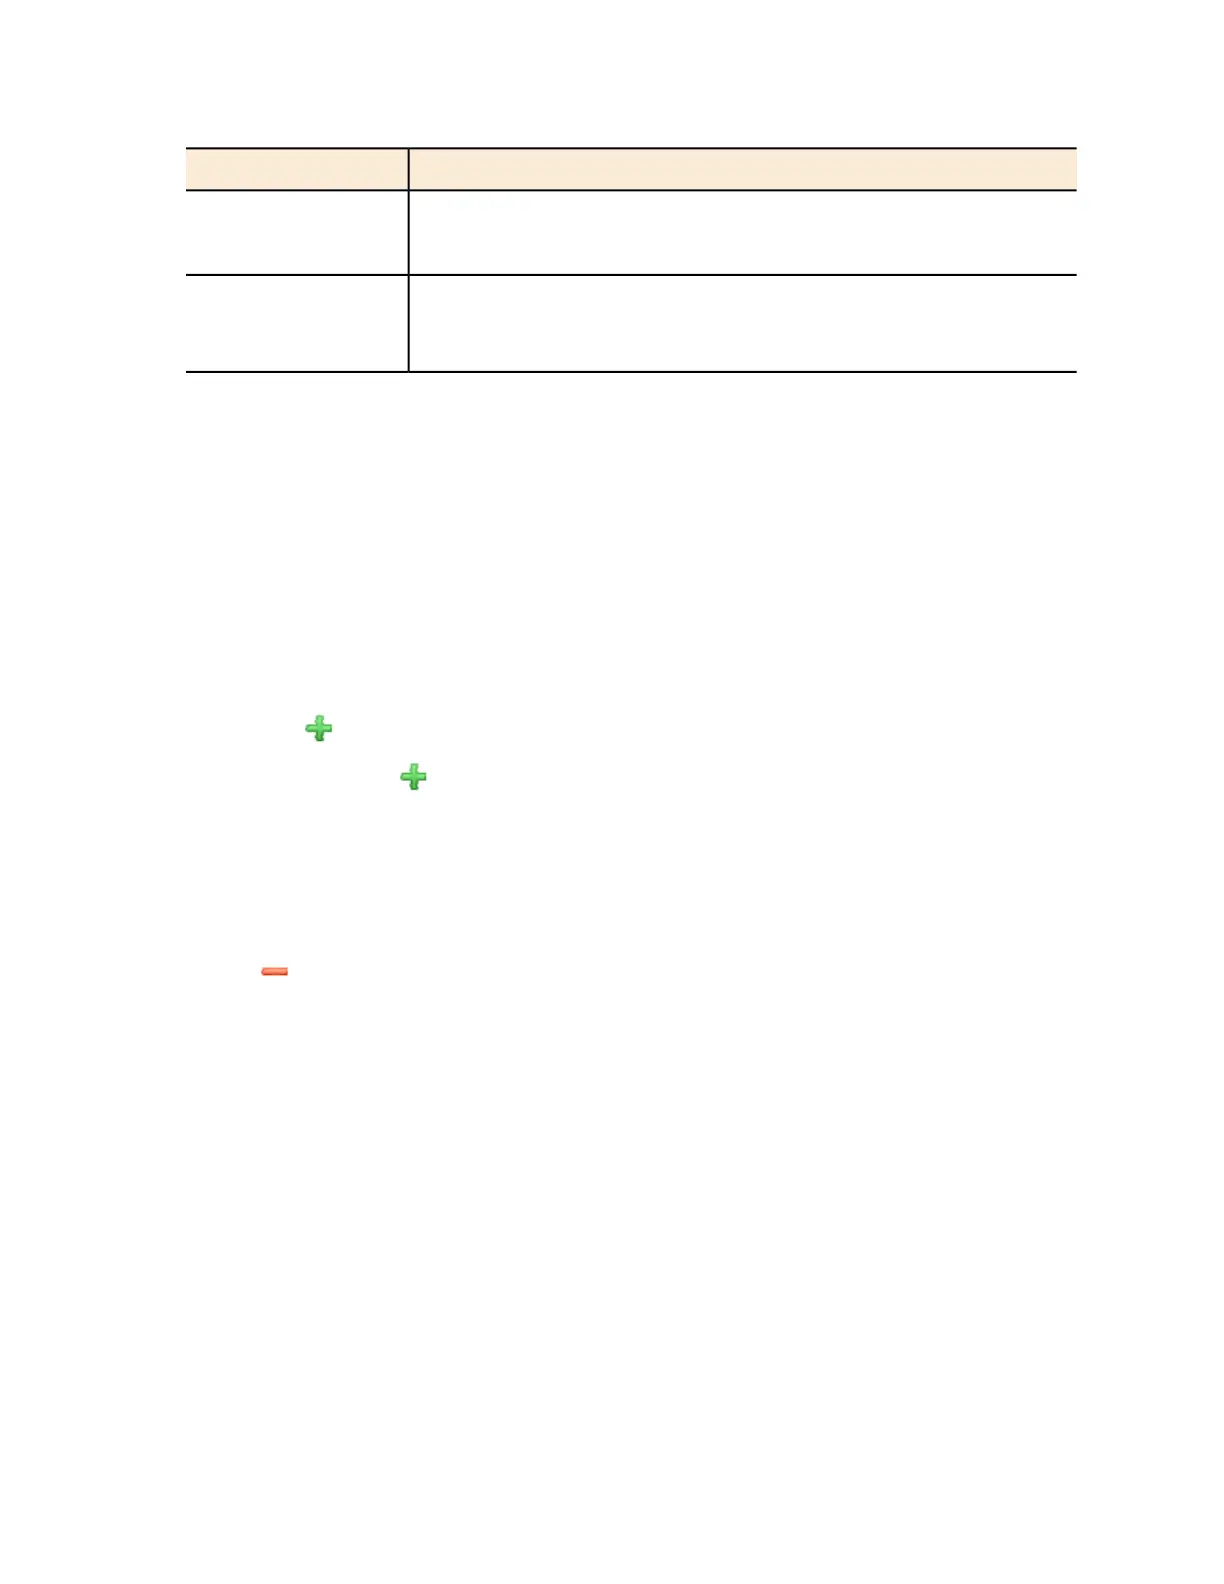
DescriptionColumn Name
Minor
Warning
Displays additional details about the event, including (if available) the
specific access point, control plane, or data plane that triggered the
event
Activity
Using the Search Criteria Section
By default, the controller displays all events that occurred on the first access point that is listed
in the domain tree.
If you want to filter the events that are displayed on the page (for example, you want to display
events on a client or the controller system), use the Search Criteria section.
Follow these steps to filter events.
1. Click the gray down button next to Search Criteria to expand the section.
2. In the Source filter, select source from which to search alarms.
Options include Access Point, Client, and SCG System.
3.
Click the icon to add another filter. Available filters include (in the order that they appear
when you click the icon):
• Date and Time
• Severity
• Type
NOTE: You do not need to use all these filters. To remove a filter from the search criteria,
click the icon next to the filter that you want to delete. The search criteria are case-sensitive.
4. Define the filters that you want to use.
For example, if you want to view all critical events on all access points, select Access Point
in Source, leave Search Plane by blank, and then select Critical in Severity.
5. Click Search.
The page refreshes and displays the events that match the search criteria that you defined.
SmartCell Gateway 200/Virtual SmartZone High-Scale for Release 3.4.1 Administrator Guide
309
Monitoring the System, Alarms, Events, and Administrator Activity
Viewing Events
 Loading...