NOTE: Events that require your attention are called alarms. For information on alarms, refer to
Viewing Alarms on page 304.
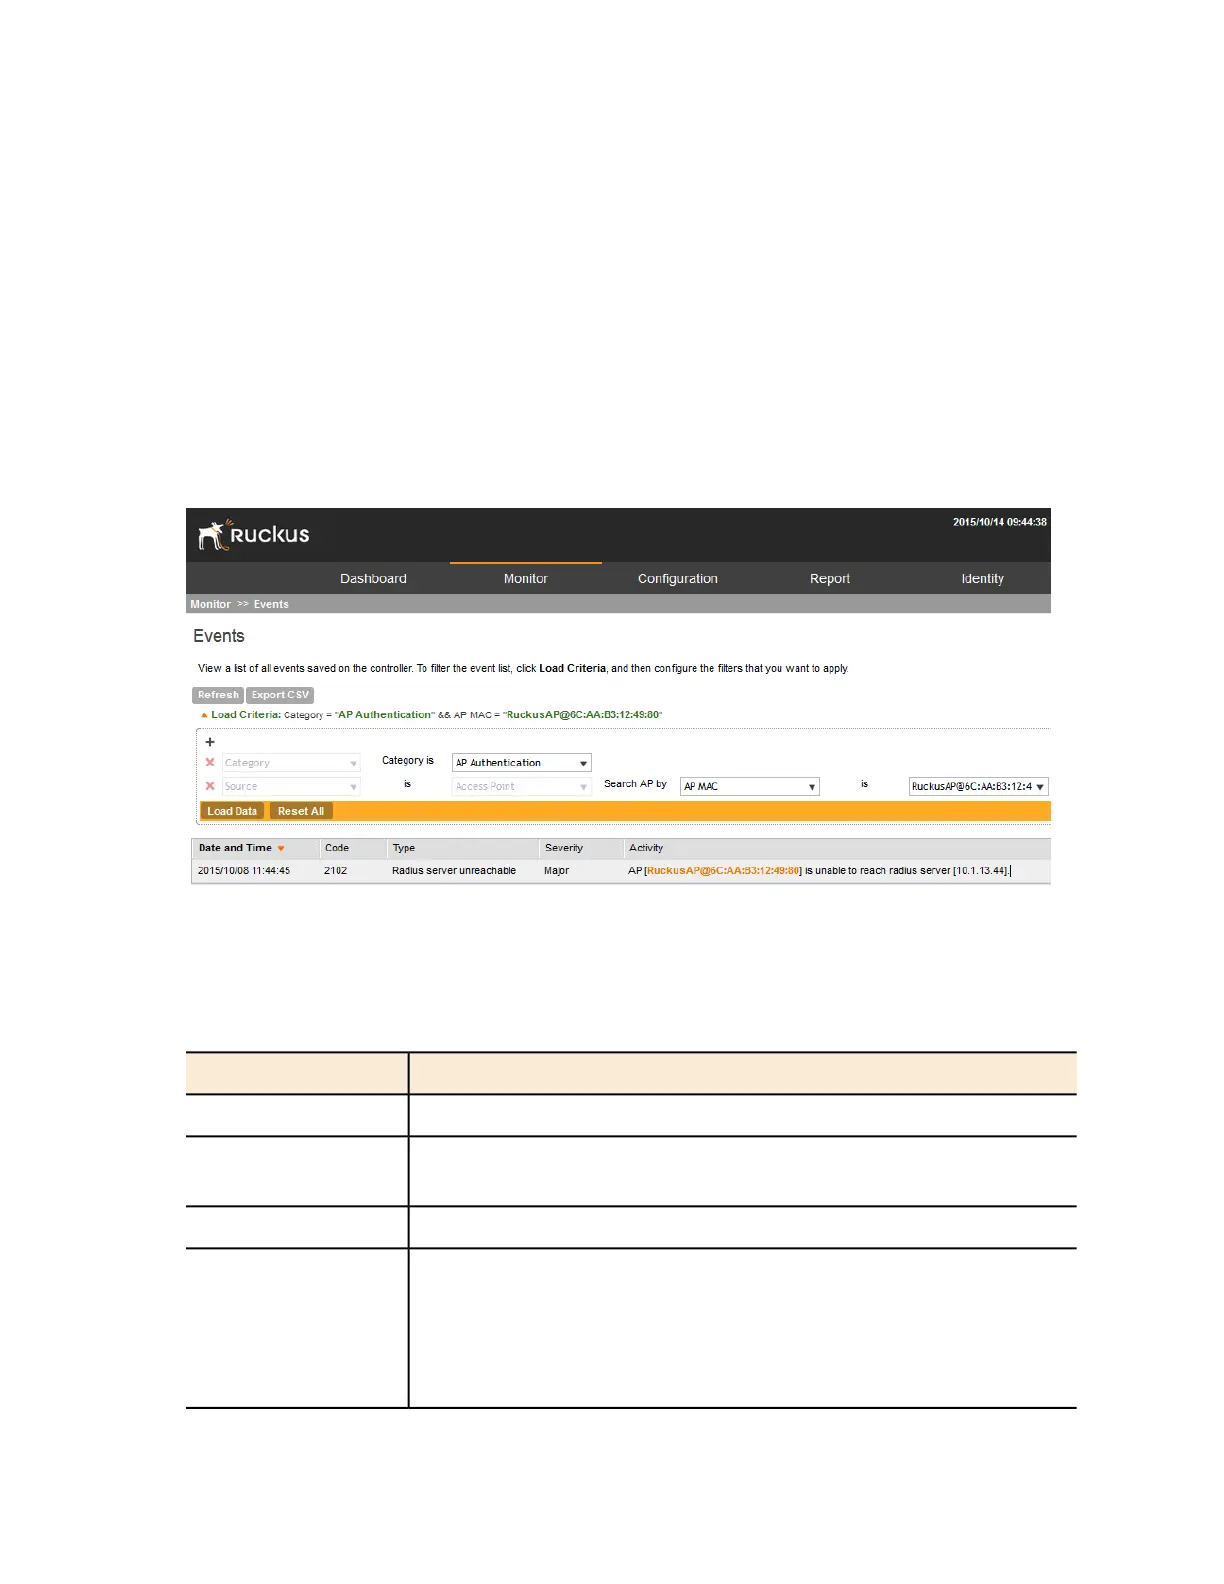
Follow these steps to view recent events that have been detected by the controller.
Go to Monitor > Events.
The Events page appears and displays the 20 most recent events that have occurred.
NOTE: By default, the Events page displays up to 20 event entries per page. You can change
the number of events to display per page by selecting a number in Show. Options range from
10 to 250 entries per page. Alternatively, you can click the >> (next) link to display the next
20 events on another page.
Figure 172: The Events page lists the most recent events that have occurred
Table 18: Event details on page 308 lists the event details that are displayed on the Events page.
Table 18: Event details
DescriptionColumn Name
Date and time when the event occurredDate and Time
Event code (see the Alarm and Event Reference Guide for your controller
platform more information)
Code
Type of event that occurred (for example, AP configuration updated)Event Type
Severity level assigned to the event. Possible values include (from most
severe to least severe):
Critical
Severity
Major
SmartCell Gateway 200/Virtual SmartZone High-Scale for Release 3.4.1 Administrator Guide
308
Monitoring the System, Alarms, Events, and Administrator Activity
Viewing Events
 Loading...