SmartAXIS Touch User’s Manual 10-1
10
Charts
This chapter describes how to configure charts and meters and their operation on the Touch.
1.1 How the Bar Chart is Used
Bar charts and peak charts can be used to display values of word devices.
• Display values of word devices in a bar chart
• Display values of word devices in a peak chart
• Make the chart blink when the displayed data exceeds the maximum or minimum
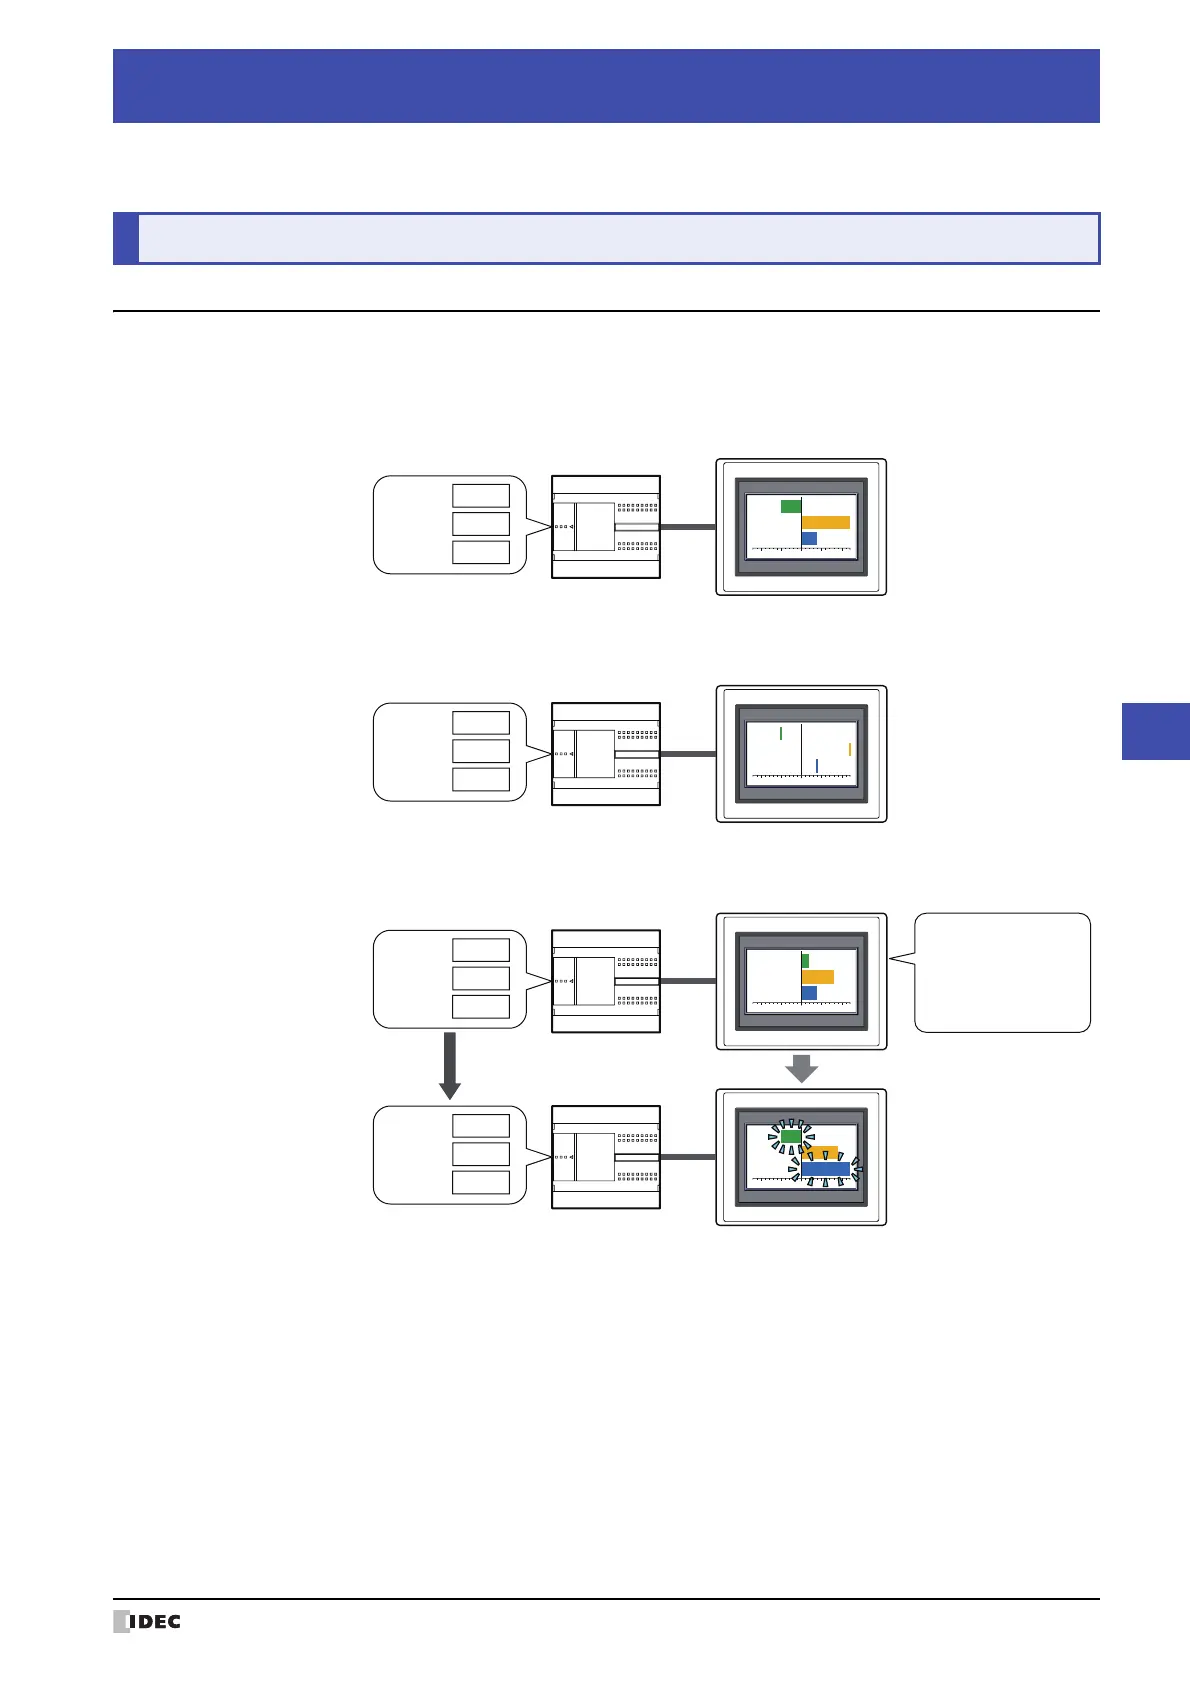
Chapter 10 Charts
1 Bar Chart
External device
Tou ch
D100 :
-50
D200 :
120
D300 :
40
External device
Tou ch
D100 :
-50
D200 :
120
D300 :
40
External device
Tou ch
Range: Value
Minimum : 0
Maximum : 100
When Data Over
Blink: Selected
D100 :
20
D200 :
80
D300 :
40
D100 :
-50
D200 :
90
D300 :
120