SmartAXIS Touch User’s Manual 10-21
2 Line Chart
10
Charts
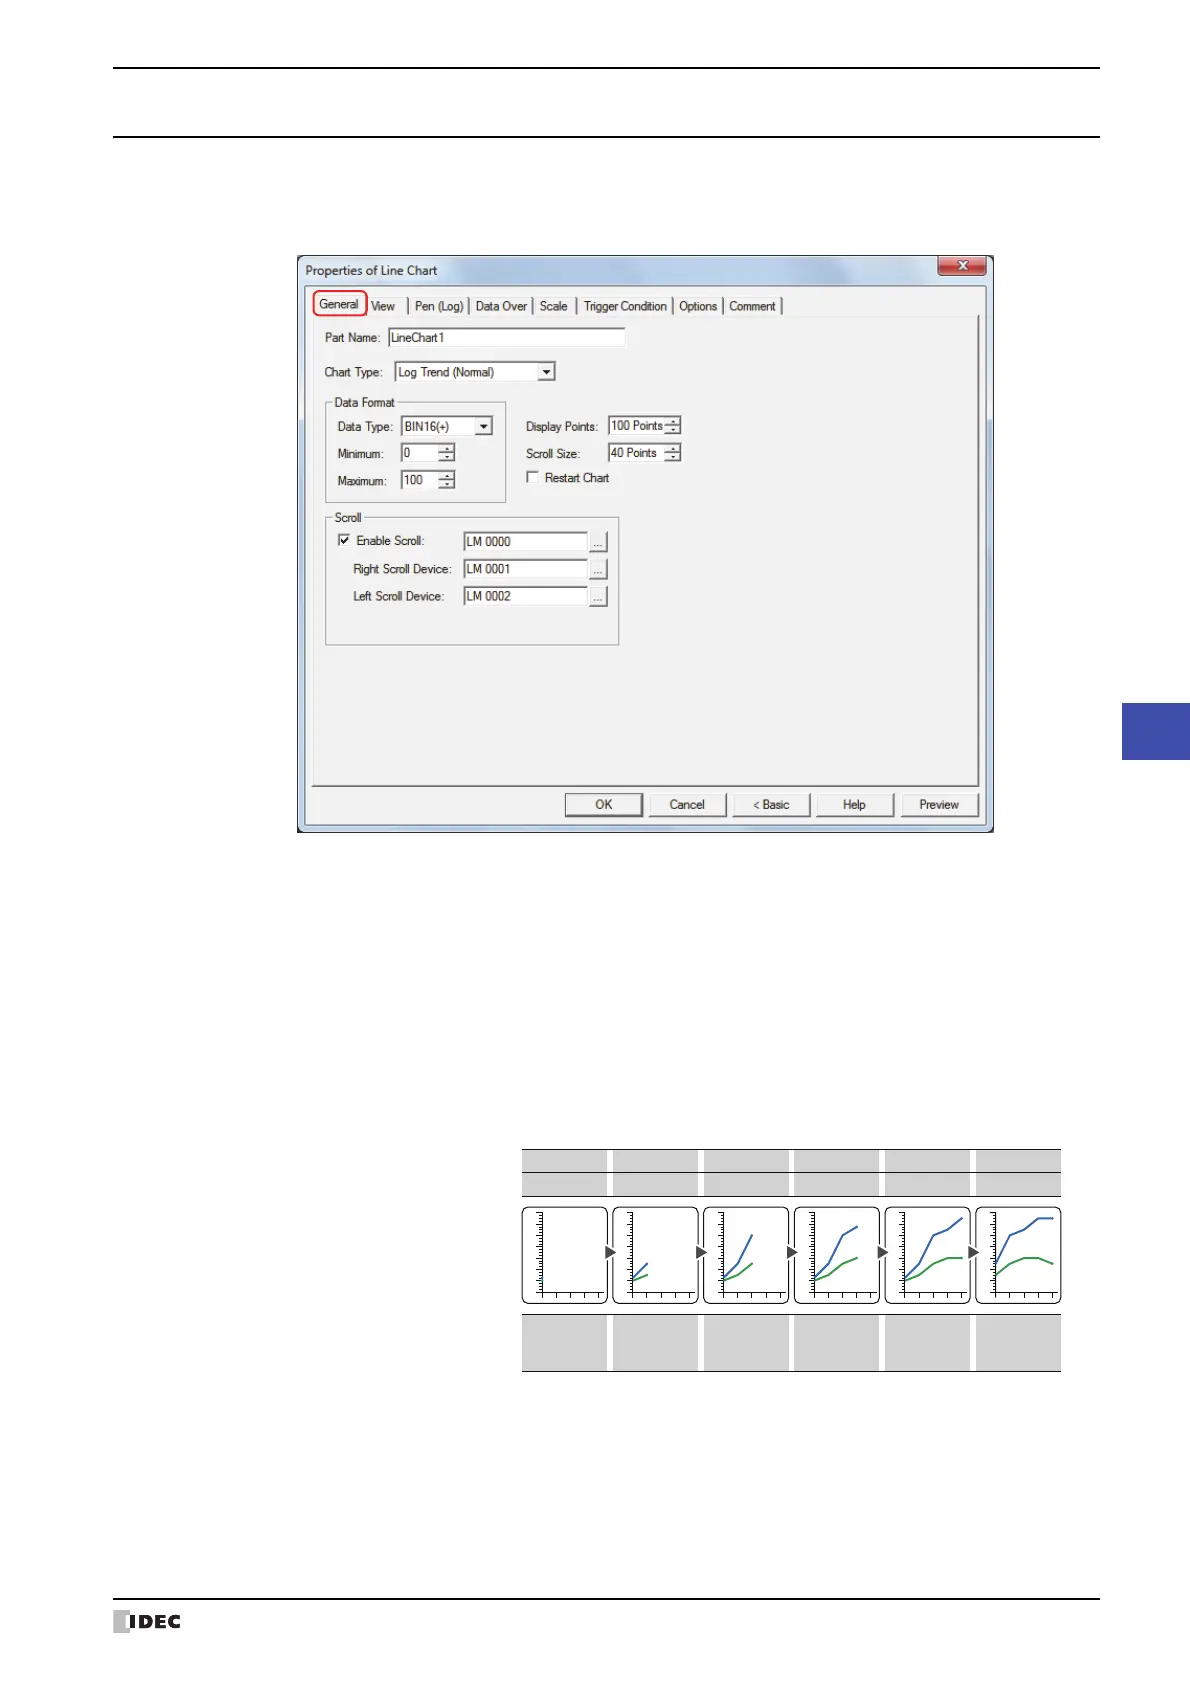
2.3 Properties of Line Chart Dialog Box
This section describes items and buttons in the Properties dialog box.
●
General Tab
■ Part Name
Enter a name for the part. The maximum number is 20 characters.
■ Chart Type
Selects the type of chart from the following.
Log Trend (Normal): Shows values of devices sampled with the Data Log function in a trend chart. The
displayed chart is updated each time the latest data is sampled and the latest data is
charted from the left edge. If the sampled data exceeds the number of display points,
the entire chart is shifted to the left by the configured scroll size and the display is
updated.
Example: When Display Points is 5 and Scroll Size is 1
Ch1 data 30
Ch2 data
10
Display
80
30
90
40
110
40
110
30
5
Action
0
Scroll,
display point 6
Display point 1 Display point 2 Display point 3 Display point 4 Display point 5
0
20
40
60
80
100
-20
120
0
20
40
60
80
100
-20
120
0
20
40
60
80
100
-20
120
0
20
40
60
80
100
-20
120
0
20
40
60
80
100
-20
120
0
20
40
60
80
100
-20
120