SmartAXIS Touch User’s Manual 10-39
3 Pie Chart
10
Charts
3.1 How the Pie Chart is Used
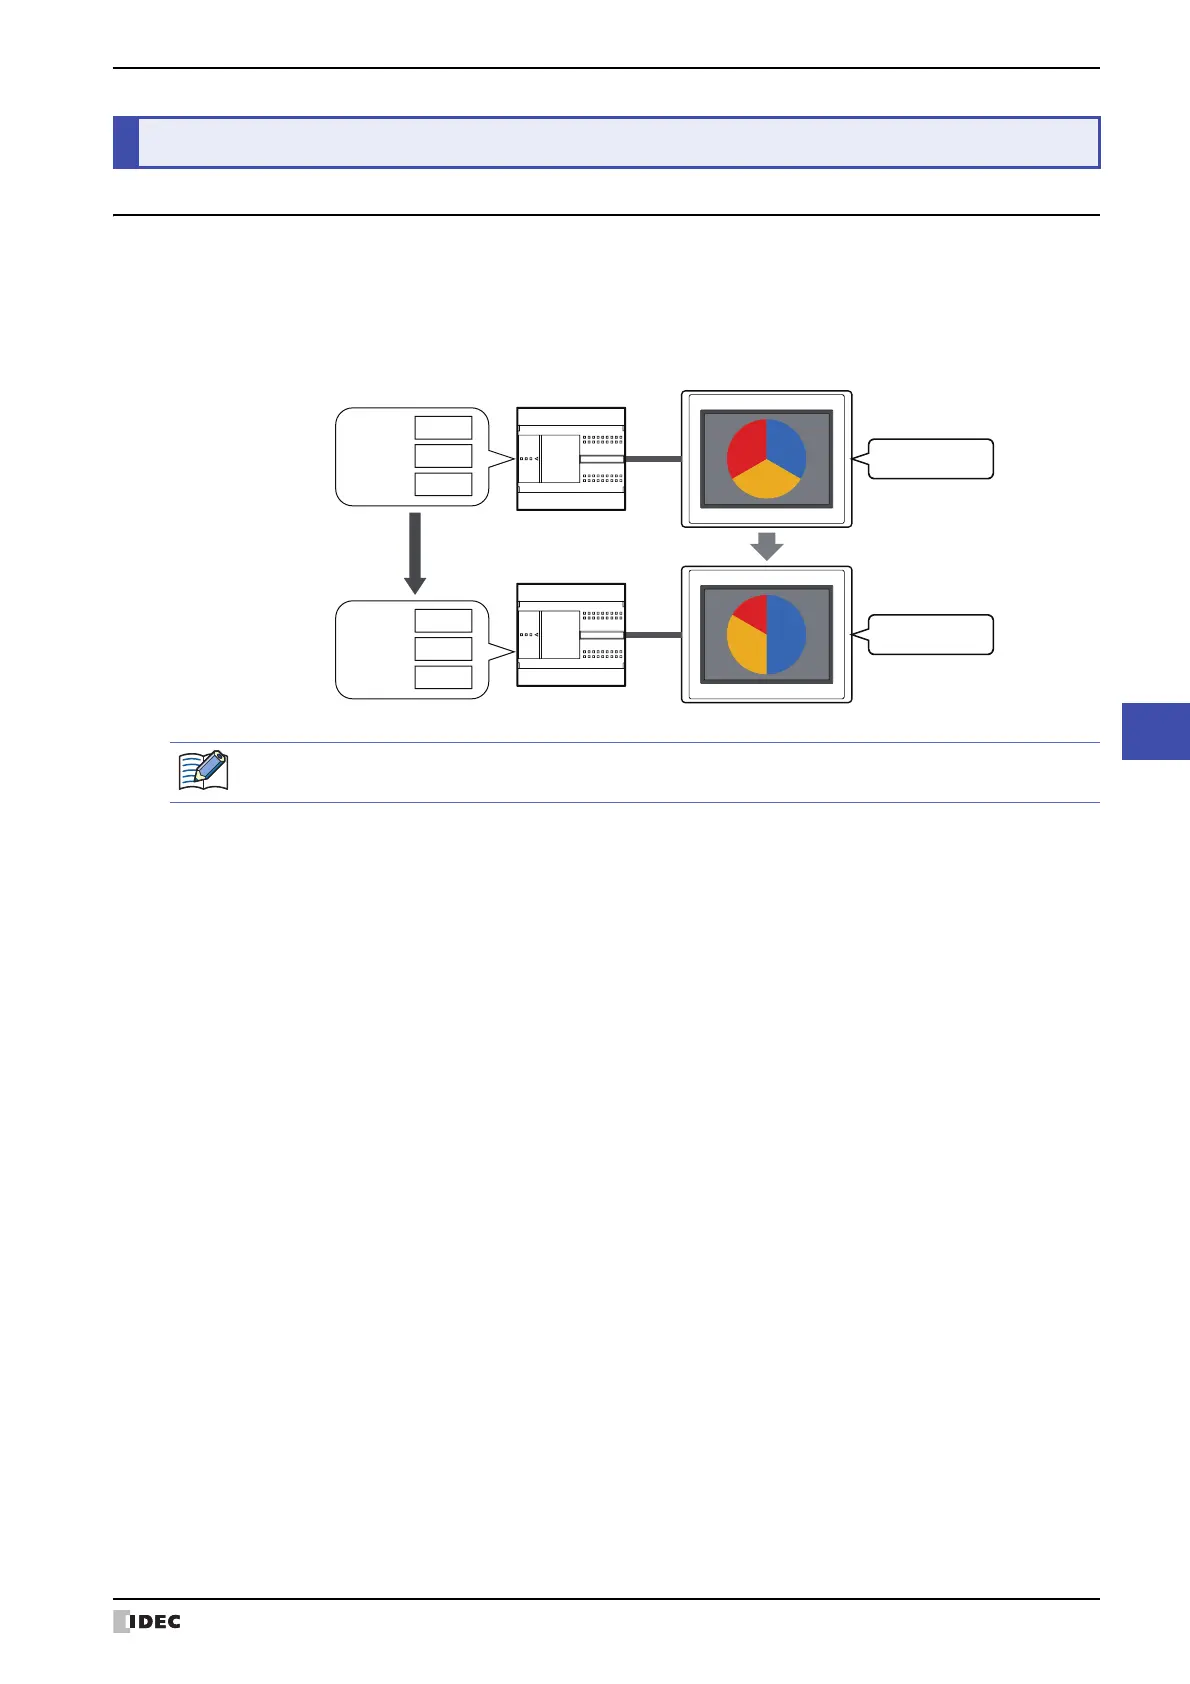
The stacked bar chart and pie chart are used to show the proportion of individual data to the sum of the data.
They can be used to check the relative change in the values of multiple devices in real-time.
• Display the proportion for the sum of values of multiple devices in a stacked bar chart or a pie chart
3Pie Chart
External device
Tou ch
1 : 1 : 1
4 : 2 : 1
D100 :
10
D200 :
10
D300 :
10
D100 :
120
D200 :
60
D300 :
30
If the source data is all 0, the chart shows the same proportion for all the data.