SmartAXIS Touch User’s Manual 14-25
4 Using the Data
14
Data Log Function
4.1 Display the Data in the Line Chart
You can display the sampled data in the Line Chart.
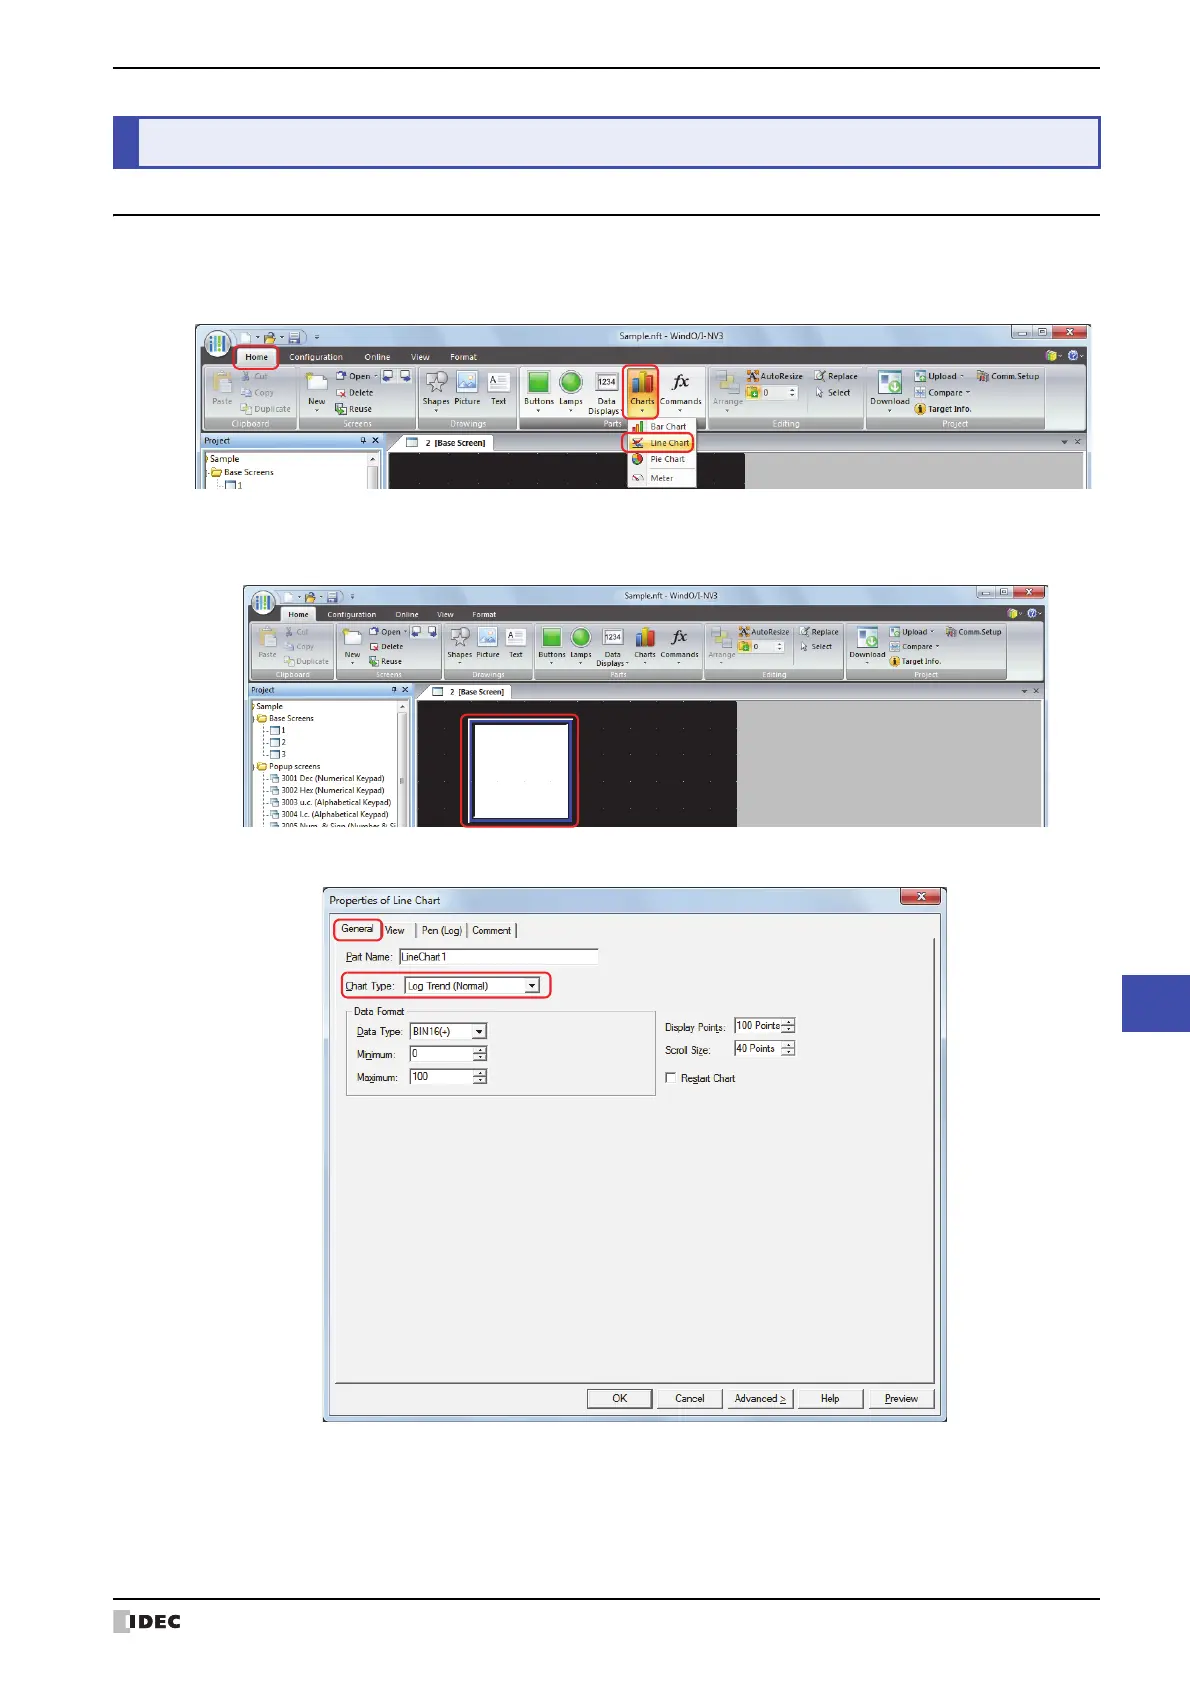
1 On the Home tab, in the Parts group, click Charts, and then click Line Chart.
2 Click a point on the edit screen where you want to place the Line Chart.
3 Double-click the dropped Line Chart and a Properties dialog box will be displayed.
4 On the General tab, select Chart Type as Log Trend (Normal) or Log Trend (Pen Recorder).
4 Using the Data