4 Using the Data
14-26 SmartAXIS Touch User’s Manual
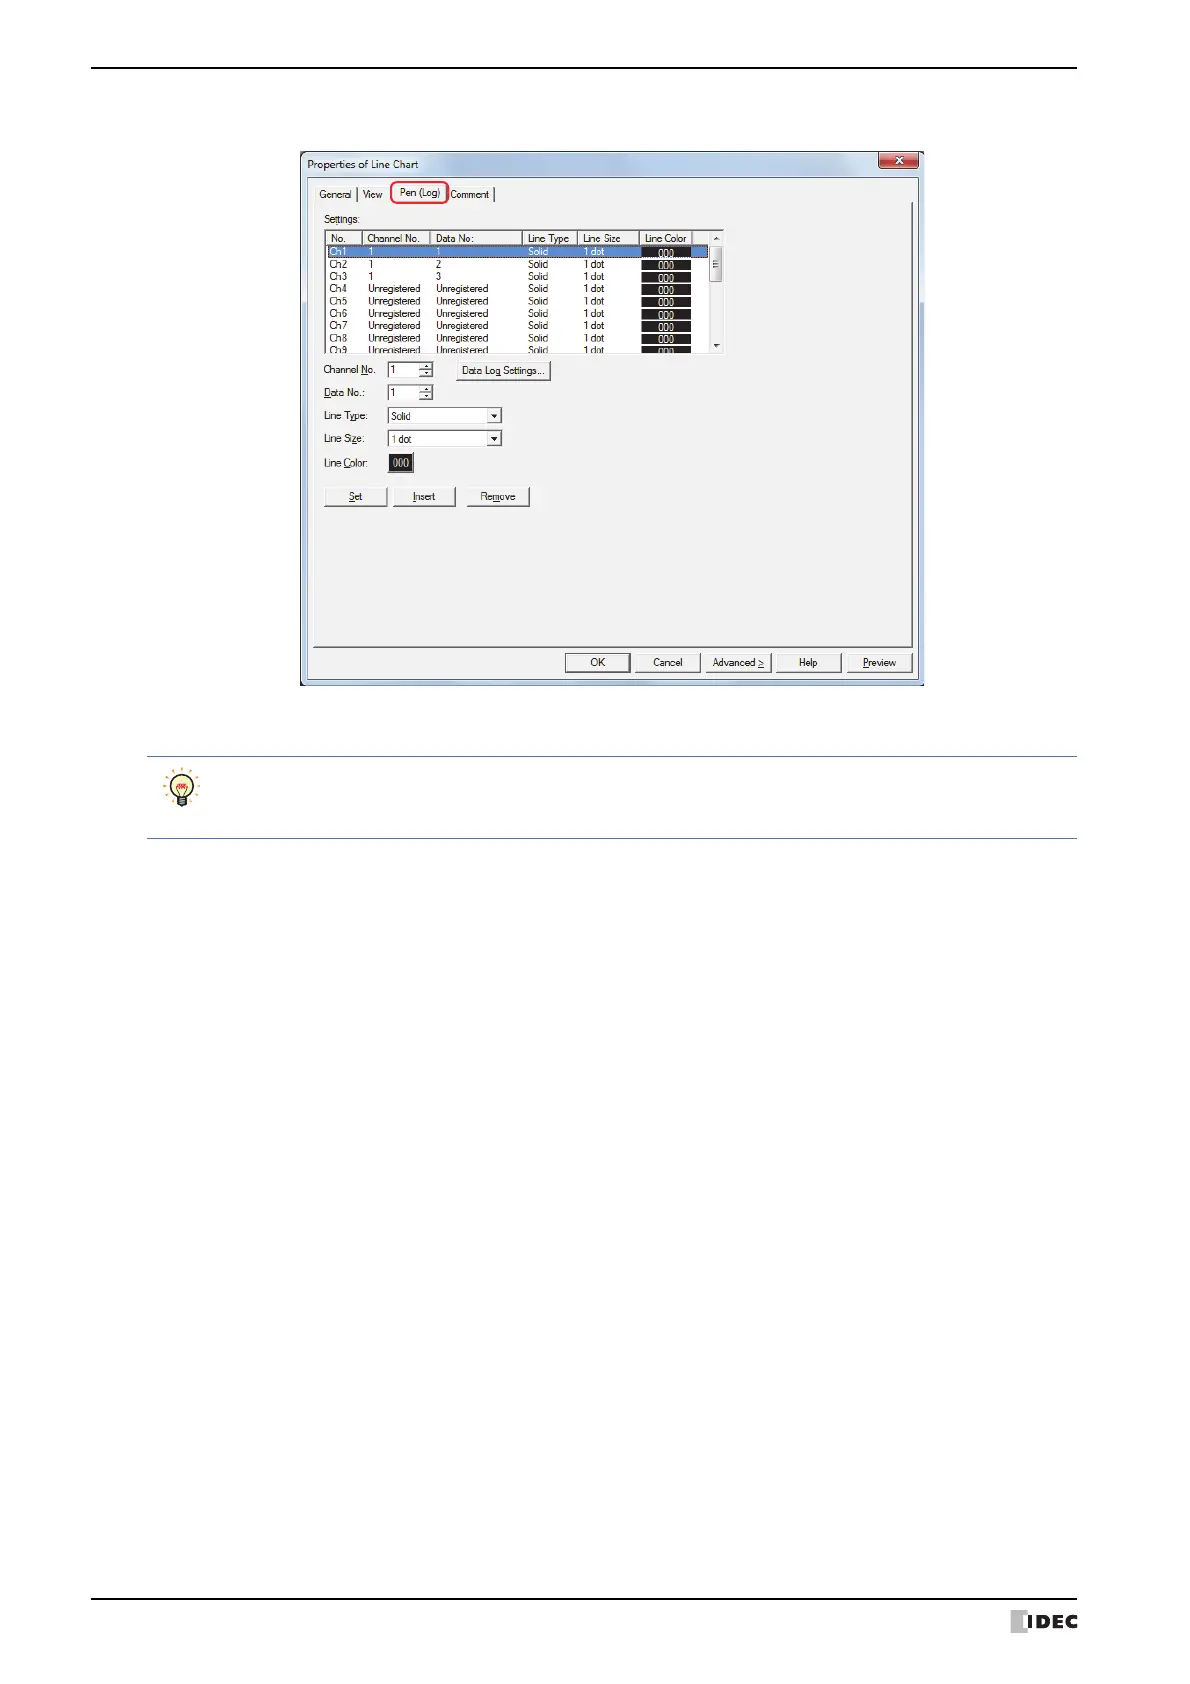
5 Click the Pen (Log) tab.
6 Specify Channel No. and Data No. for the data to display in the chart.
7 Select Line Type, Line Size, and Line Color.
8 Click Set.
The data to display in the chart is registered in the channel number (Ch1 to Ch20) for the chart selected in Settings.
9 Repeat steps 6 through 8 to register the data to display in the chart.
10
Click OK.
The Properties dialog box closes.
This concludes configuring the Line Chart.
Click Data Log Settings to display the Data Log Settings dialog box where you can configure the channel
while checking the data to display. Select Channel No. under Settings, and then click OK to close the
Data Settings dialog box. Channel No. reflects the selected channel number.