SmartAXIS Touch User’s Manual 10-19
2 Line Chart
10
Charts
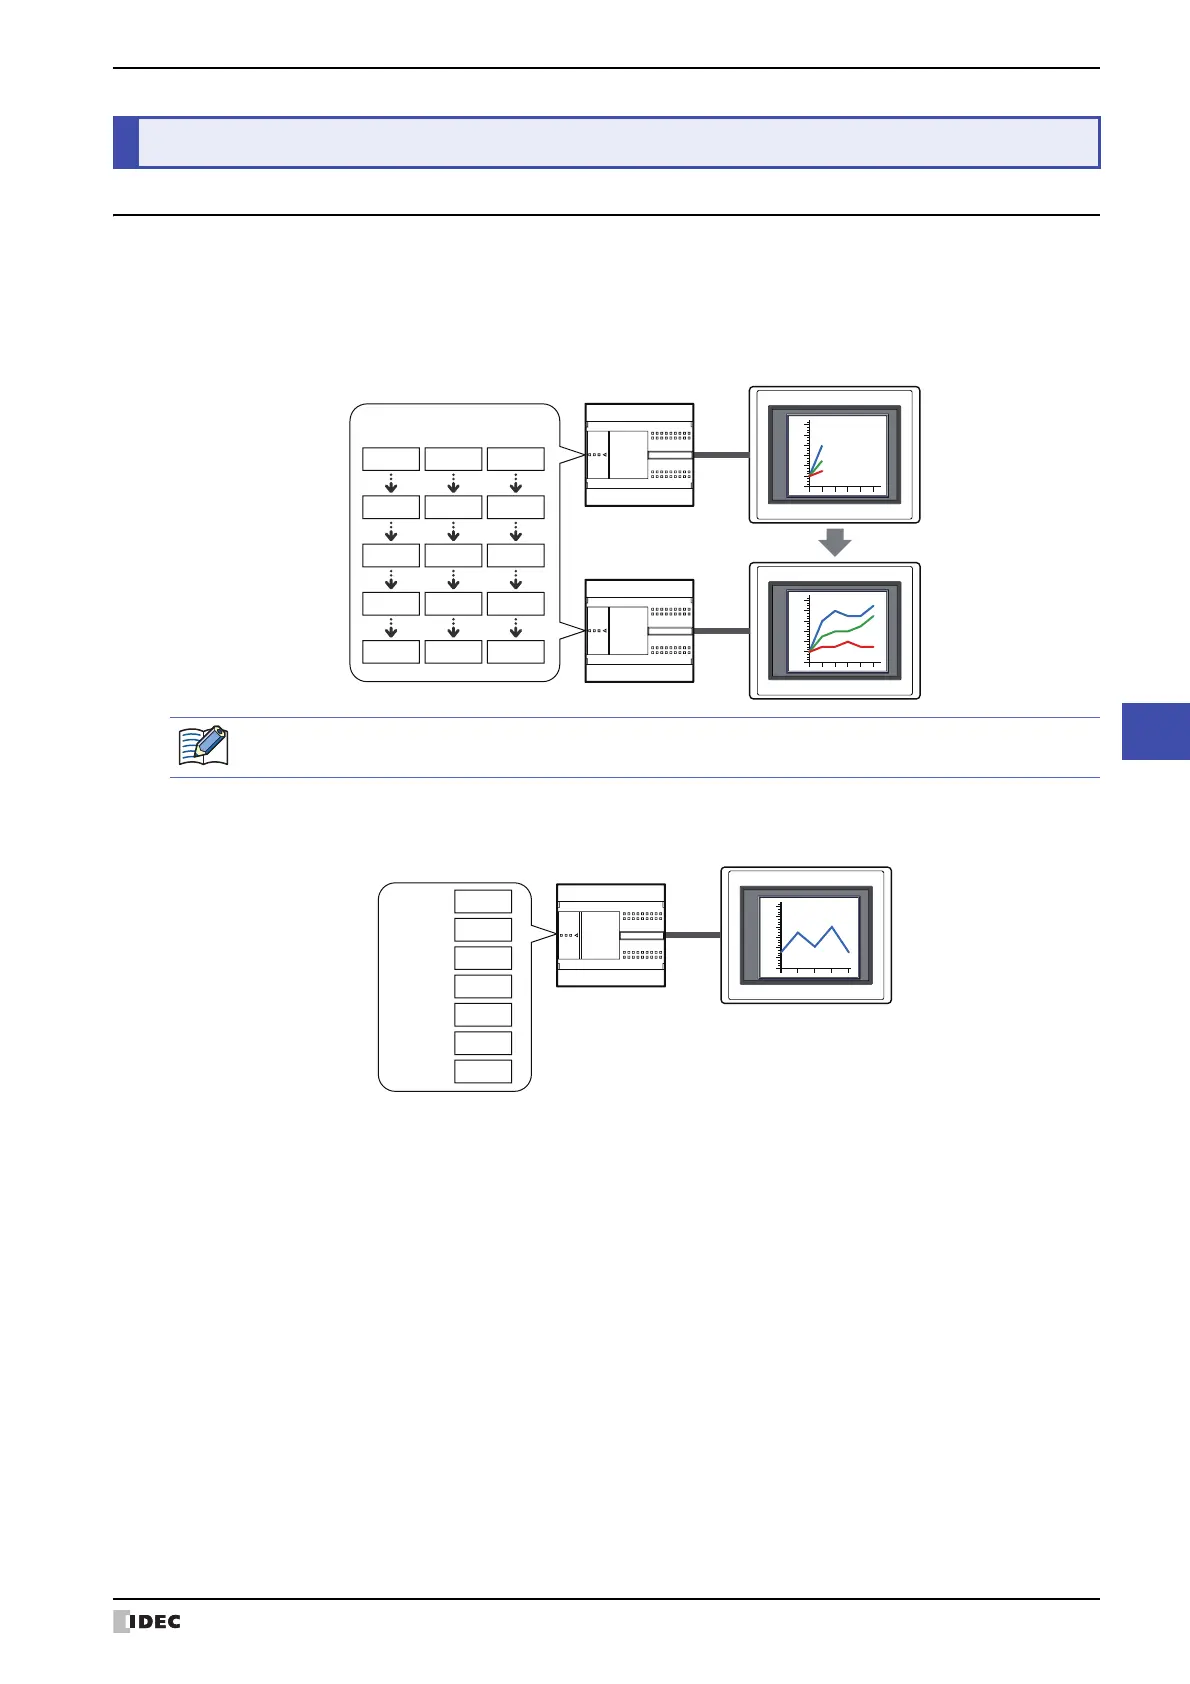
2.1 How the Line Chart is Used
The line chart can be used to display values of devices sampled with the Data Log function and the values of multiple
word devices.
• Display the values of devices sampled with the Data Log function in a trend chart
• Display the values of multiple, continuous devices in a single line chart
2 Line Chart
External device
Tou ch
D100
60
80
70
70
90
D101
30
40
40
50
70
D102
10
10
20
10
10
0
20
40
60
80
100
-20
0
20
40
60
80
100
-20
There are two types of trend charts, a normal trend chart and a pen recorder trend chart.
External device
Tou ch
D100
:
1
D101
:
5
D102
:
10
D103
:
50
D104
:
20
D105
:
60
D106
:
10
0
20
40
60
80
100
-20