SmartAXIS Touch User’s Manual 10-41
3 Pie Chart
10
Charts
3.3 Properties of Pie Chart Dialog Box
This section describes items and buttons in the Properties dialog box.
●
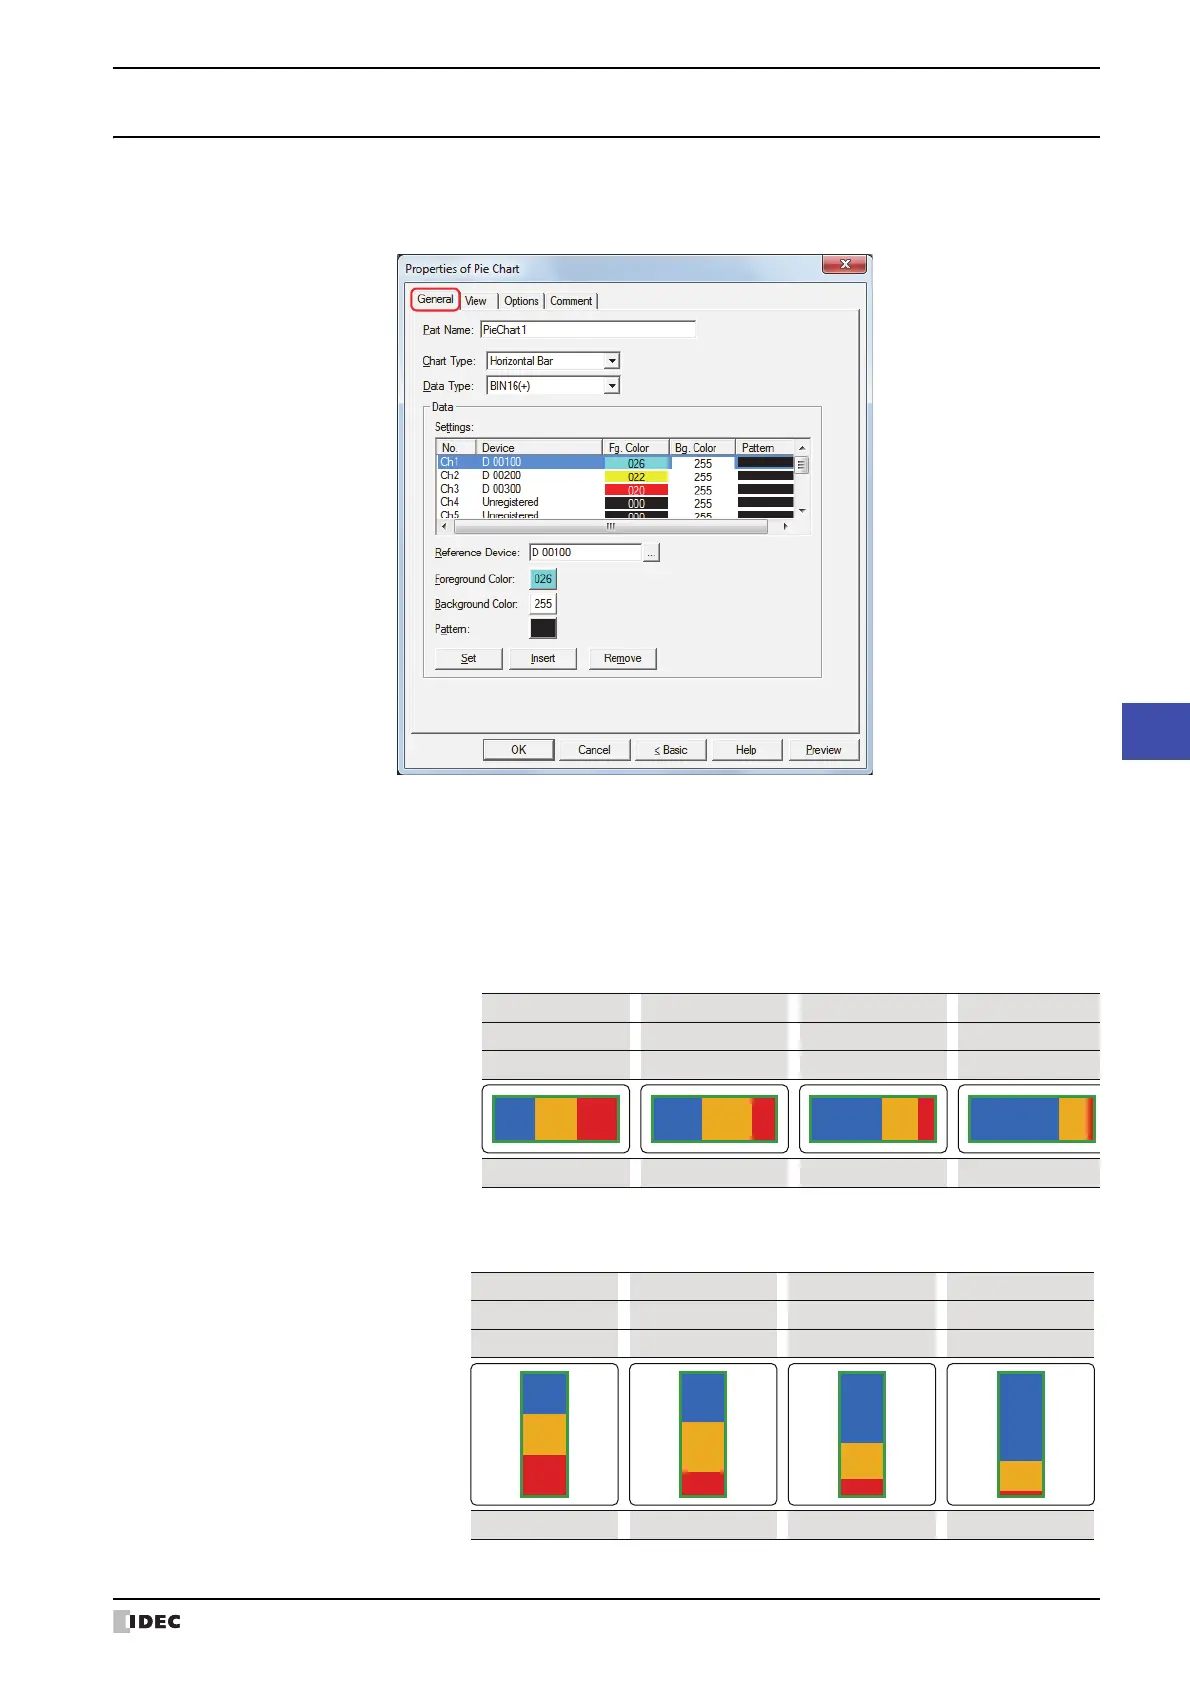
General Tab
■ Part Name
Enter a name for the part. The maximum number is 20 characters.
■ Chart Type
Select the type of chart from the following items.
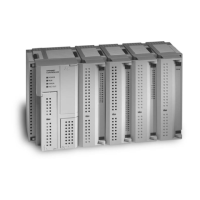
Horizontal Bar: Shows the proportion of the sum of the data as a horizontal stacked bar chart.
Example: When displaying the values for three devices
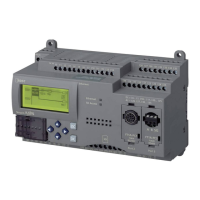
Vertical Bar: Shows the proportion of the sum of the data as a vertical stacked bar chart.
Example: When displaying the values for three devices
Horizontal Bar display
Ch3 data
0
Ch2 data 0
50
100
30
60
10
50
Ch1 data
0
100 120 150
Proportion
1 : 1 : 1
2 : 2 : 1 4 : 2 : 1 15 : 5 : 1
Vertical Bar display
Ch3 data
0
Ch2 data
0
50
100
30
60
10
50
Ch1 data
0
100 120 150
Proportion
1 : 1 : 1
2 : 2 : 1 4 : 2 : 1 15 : 5 : 1