3 Pie Chart
10-42 SmartAXIS Touch User’s Manual
■ Data Type
Selects the data type handled by the chart.
For details, refer to Chapter 2 “1.2 Available Data” on page 2-2.
■ Settings
Lists the chart settings. The list shows the numbers, source devices, and colors for the chart.
■ Reference Device
Specifies the source word device for the data to display in the chart.
Click to display the Device Address Settings dialog box. For the device address configuration procedure, refer to
Chapter 2 “5.1 Device Address Settings” on page 2-62.
■ Foreground Color
Selects the foreground color for the chart (color: 256 colors, monochrome: 8 shades).
Click this button to display the Color Palette. Select a color from the Color Palette.
■ Background Color
Selects the background color for the chart (color: 256 colors, monochrome: 8 shades).
Click this button to display the Color Palette. Select a color from the Color Palette.
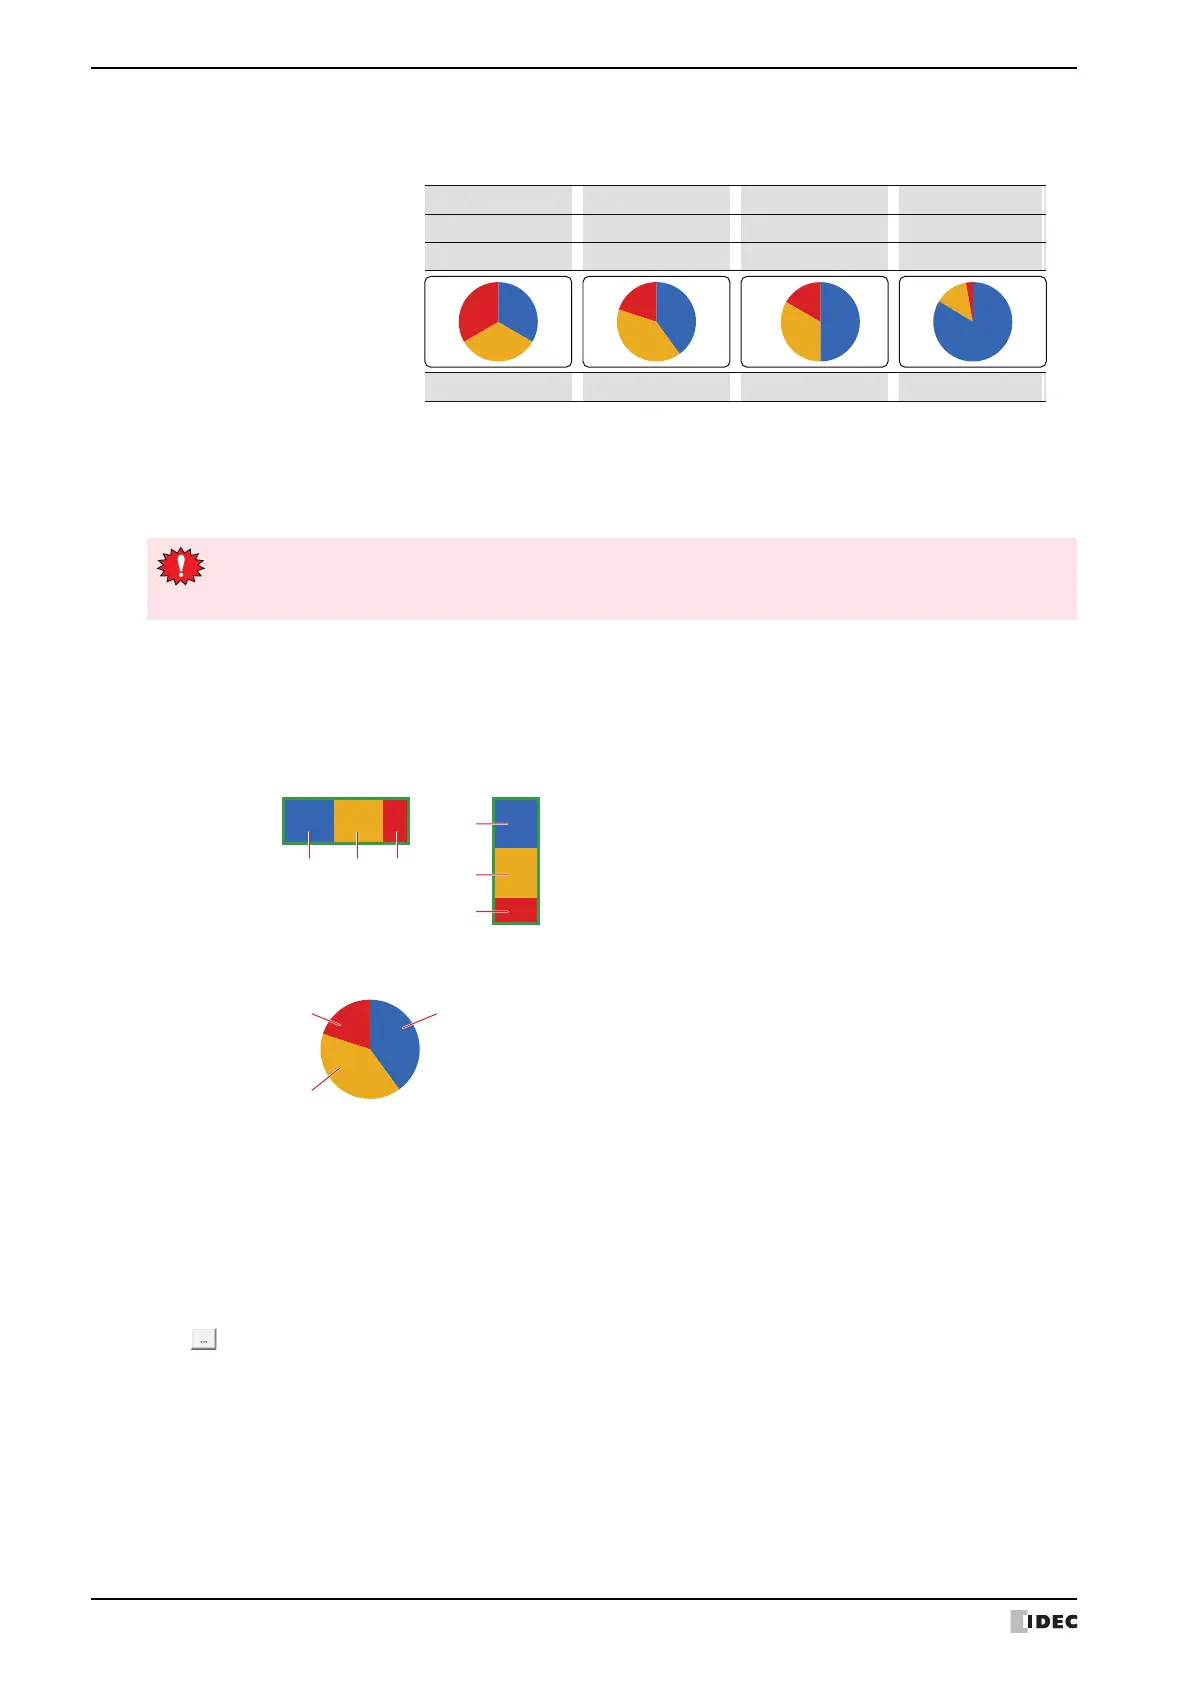
Pie: Shows the proportion of the sum of the data as a pie chart.
Example: When displaying the values for three devices
Ch3 data
0
Ch2 data
0
50
100
30
60
10
50
Ch1 data
0
100 120 300
Proportion
1 : 1 : 1
2 : 2 : 1 4 : 2 : 1 30 : 5 : 1
Pie chart display
If BCD4 or BCD8 is selected and the read data contains A through F, 1 is written to System Area 2
Arithmetic error bit (address+2, bit 5), and an error message is displayed. For details, refer to
Chapter 3 “Arithmetic error” on page 3-25.
No.: Shows the numbers for the chart (Ch1 to Ch10).
For Horizontal Bar, the numbers are listed in order from the left. For Vertical Bar, the numbers are
listed in order from the top.
For Pie, the numbers are listed clockwise.
Device: Shows the source device.
Fg. Color: Shows the foreground color of the chart.
Bg. Color: Shows the background color of the chart.
Pattern: Shows the chart pattern.
Horizontal bar Vertical bar
Ch1
Ch1 Ch2 Ch3
Ch2
Ch3