SmartAXIS Touch User’s Manual 10-11
1 Bar Chart
10
Charts
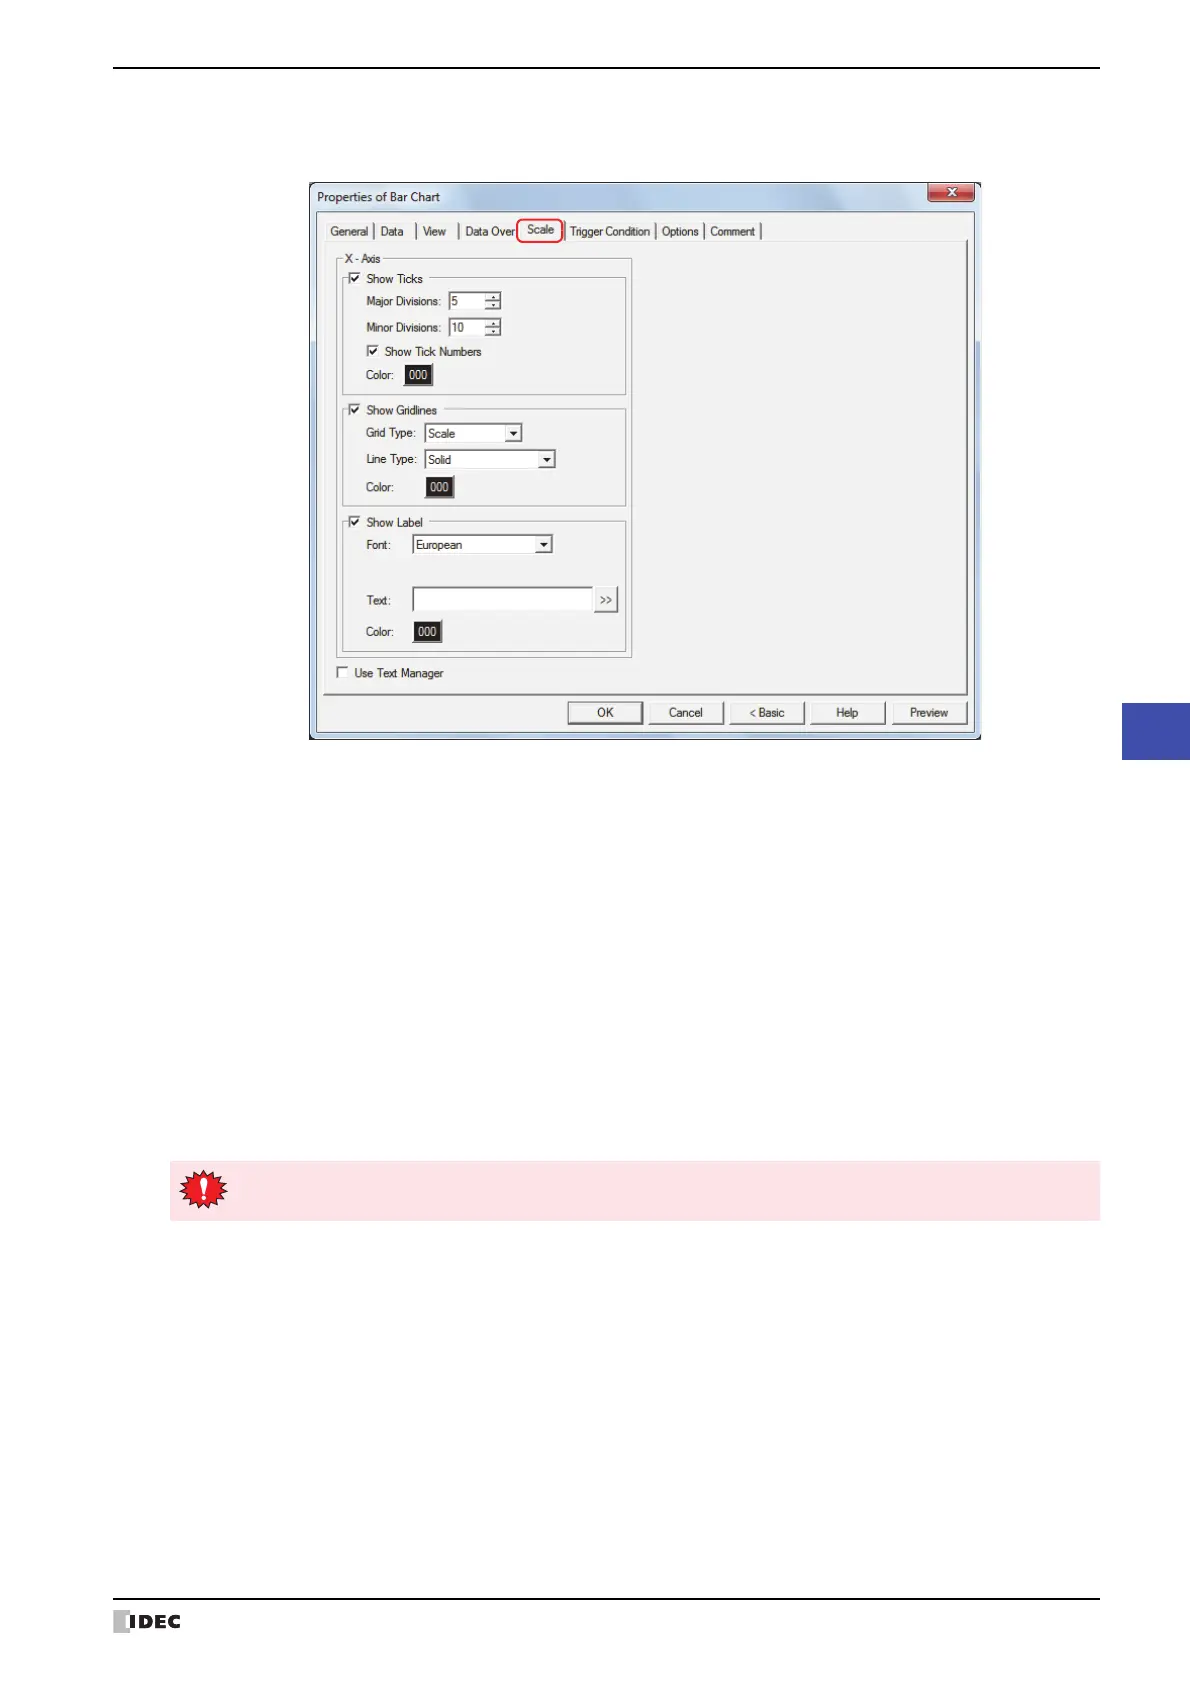
● Scale Tab
The Scale tab is displayed in Advanced mode.
The options on the Scale tab vary based on the type selected with Chart Type on the General tab.
Horizontal Bar, Horizontal Peak: X-Axis
Vertical Bar, Vertical Peak: Y-Axis
■ Show Ticks
Select this check box to display a scale on a chart.
Major Divisions: Enter the number of major scale divisions (1 to 20).
Minor Divisions: Enter the number of minor scale divisions (1 to 20).
Show Tick Numbers: Select this check box to display numbers along the scale. The values are displayed in the same
color as the scale.
This can only be set if Value is selected for Data Format under the General tab.
Color: Selects the color of scales (color: 256 colors, monochrome: 8 shades).
Click the Color button to display the Color Palette. Select a color from the Color Palette.
If the area for displaying the scale is small, the scale will not be displayed properly.