SmartAXIS Touch User’s Manual 10-23
2 Line Chart
10
Charts
■ Data Format
■ Display Points
Specifies the maximum number of points of data to display on the chart (2 to (Base Screen horizontal size)).
This option can only be configured when Log Trend (Normal) or Log Trend (Pen Recorder) is selected for Chart
Type.
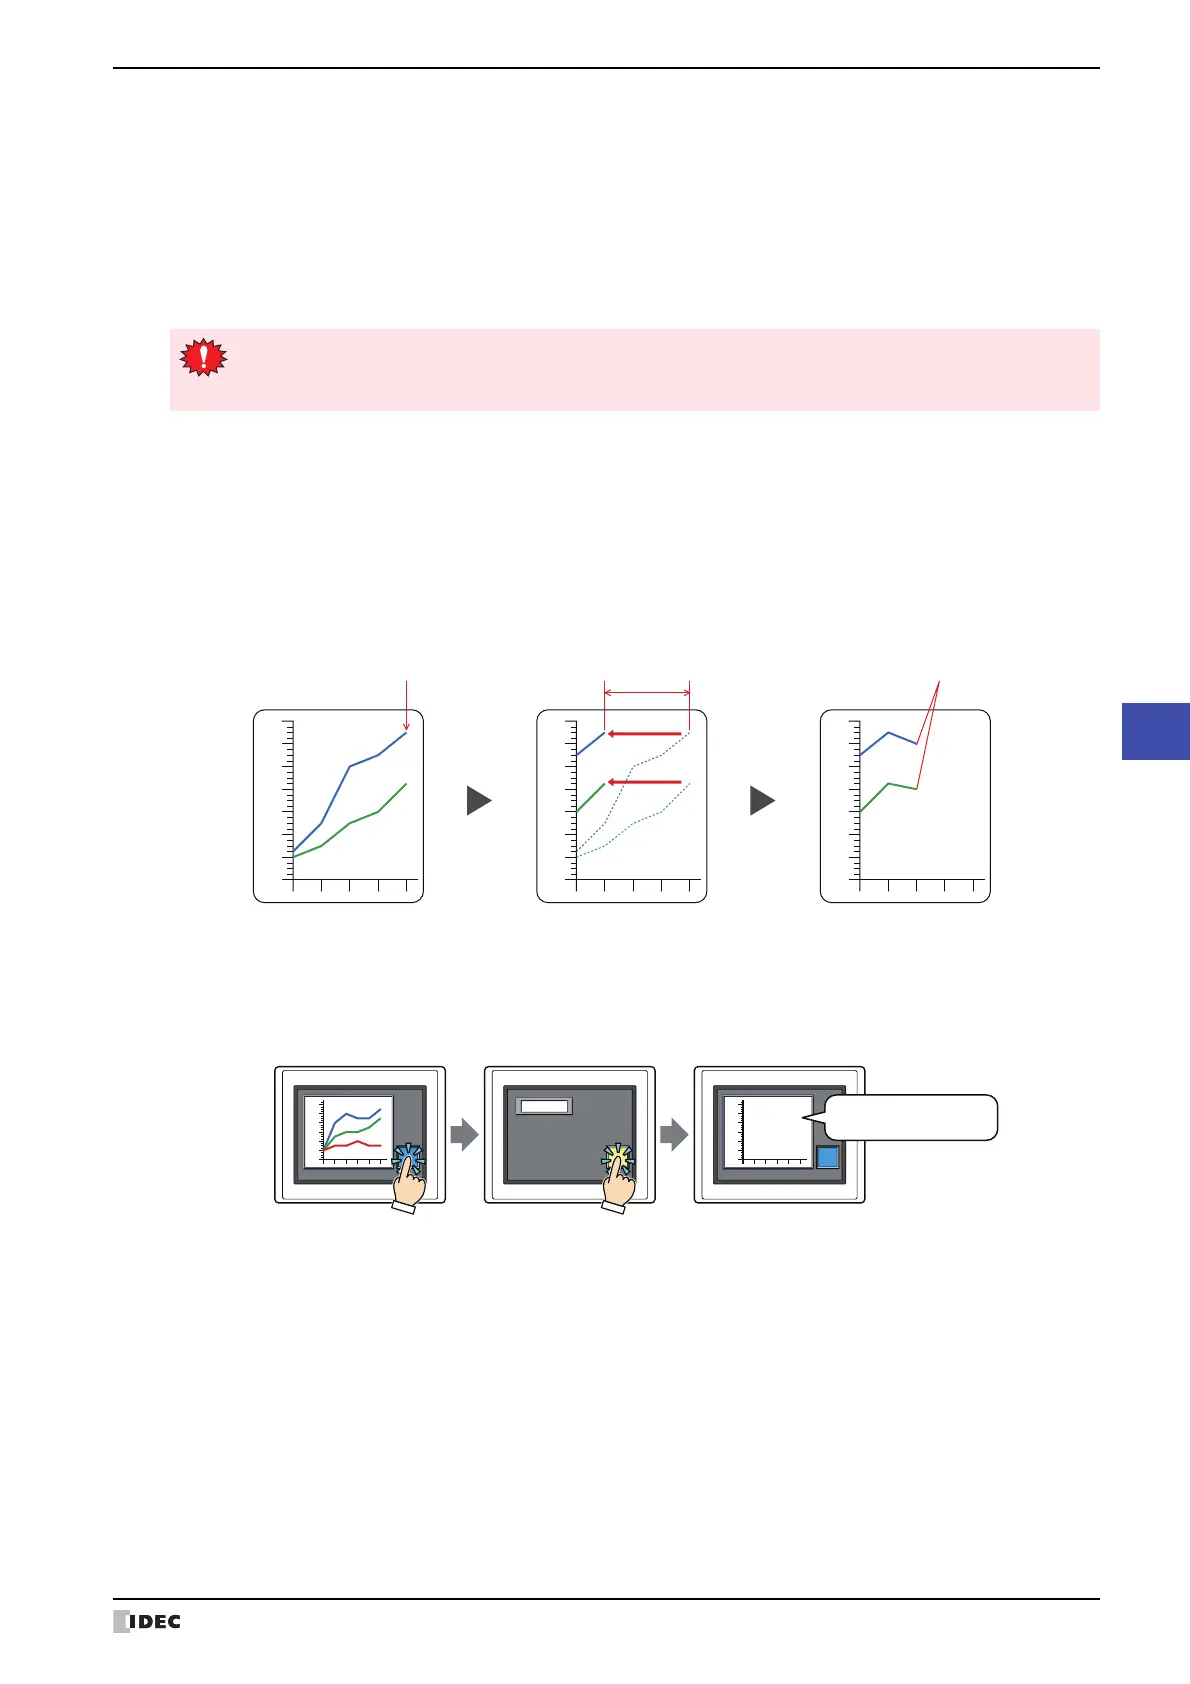
■ Scroll Size
Specifies the number of points of data to scroll when updating the chart display (1 to (Base Screen horizontal size)).
This option can only be configured when Log Trend (Normal) is selected for Chart Type.
Example: When Display Points is 5 and Scroll Size is 3
■ Restart Chart
Select this check box to display the chart from the beginning when switching screens.
This option can only be configured when Log Trend (Normal) or Log Trend (Pen Recorder) is selected for Chart
Type.
Data Type: Selects the data type handled by the chart from the following.
BIN16(+), BIN16(+/-), BCD4
For details, refer to Chapter 2 “1.2 Available Data” on page 2-2.
Minimum, Maximum:
Specifies the minimum and maximum for the chart.
The minimum and maximum vary based on the selected data type. For details, refer to Chapter
2 “1.2 Available Data” on page 2-2.
If BCD4 is selected for Data Type and the read data contains A through F, 1 is written to System Area 2
Arithmetic error bit (address+2, bit 5), and an error message is displayed. For details, refer to Chapter 3
“Arithmetic error” on page 3-25.
0
20
40
60
80
100
-20
120
0
20
40
60
80
100
-20
120
0
20
40
60
80
100
-20
120
2. Shift data 3 points left.1. Reached maximum amount
of data to display.
3. Display next data.
Tou ch Touc h To uc h
1234
0
20
40
60
80
100
-20
0
20
40
60
80
100
-20
Switch screen Switch screen
Base Screen 1 Base Screen 1Base Screen 2
Display chart
from beginning.