SAMPLING mode
586
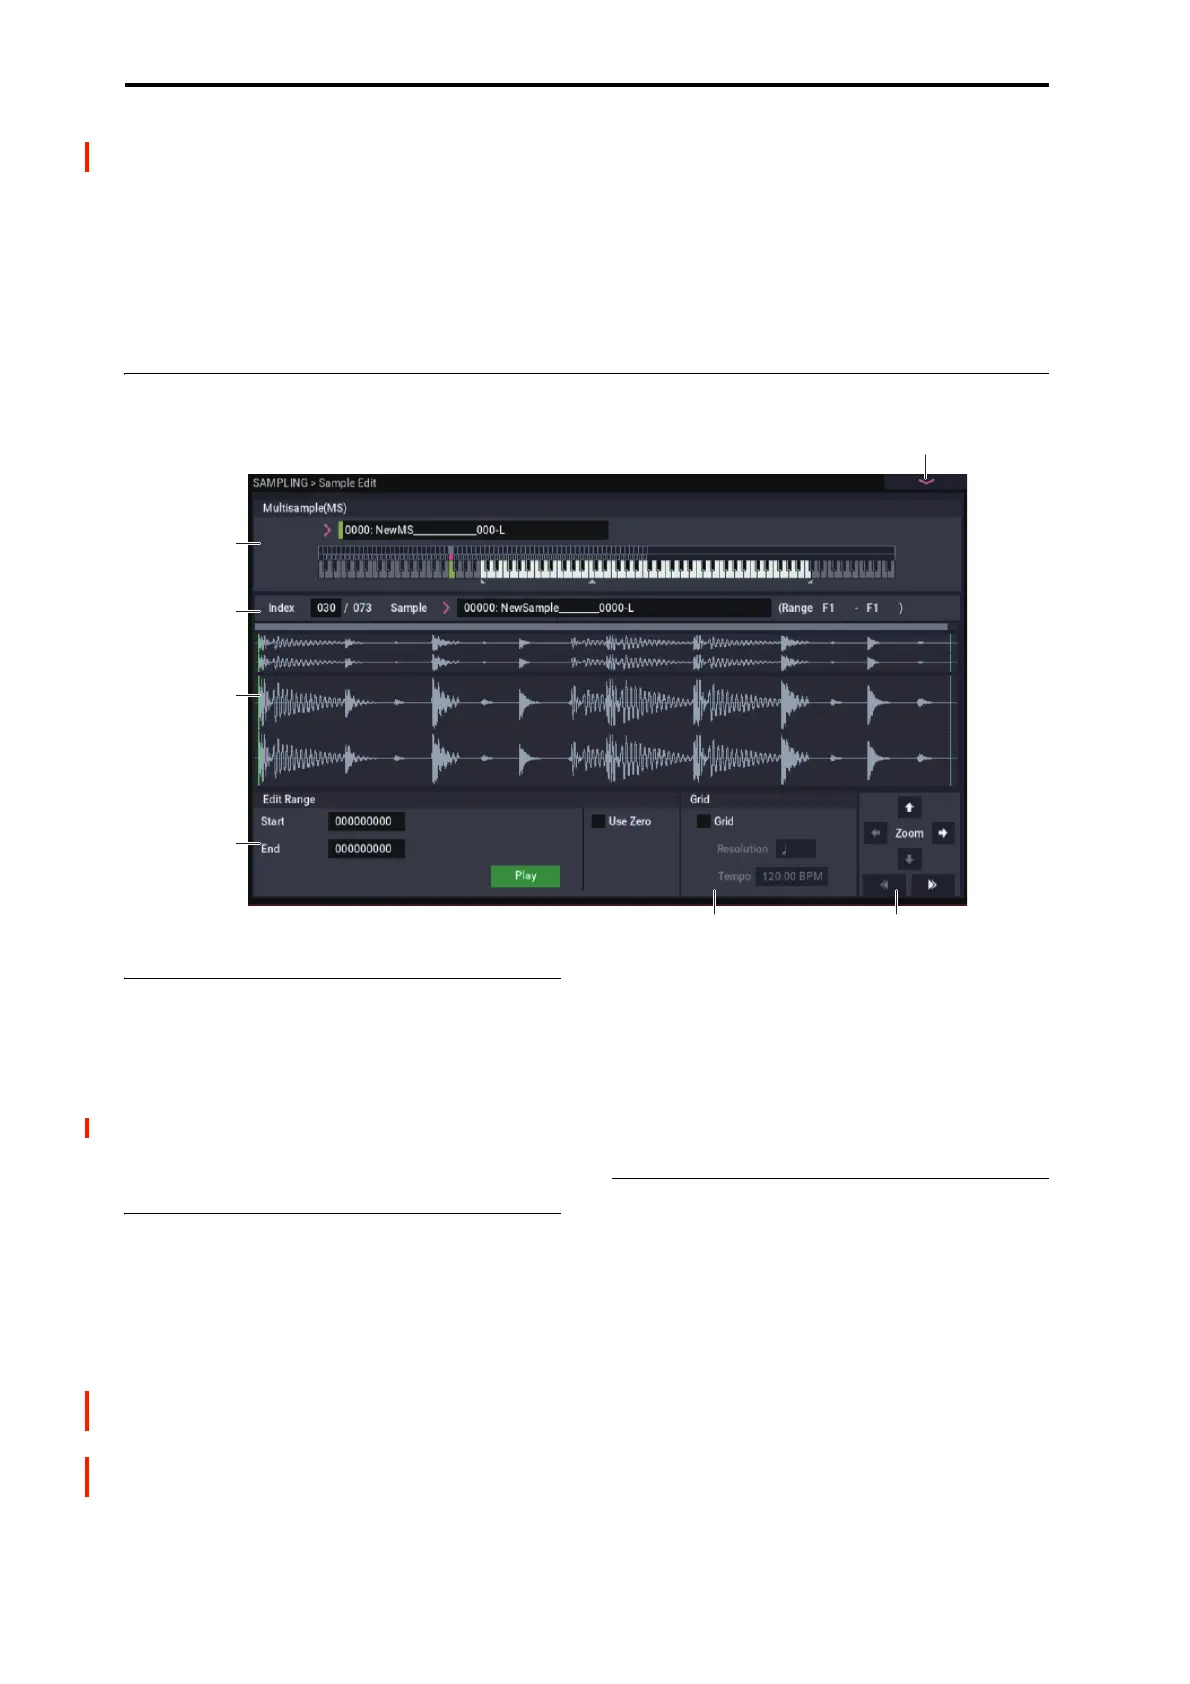
SAMPLING > Sample Edit
In this page you can edit sample data (waveform data). You
can make detailed edits while watching the sample
waveform display. Here are the main operations you will
perform in this page.
• Truncate (delete unwanted regions), copy, paste, move,
normalize (boost the level as high as possible without
distortion), rate convert (lower the sampling frequency),
reverse (backward playback), and link (connect two
samples)
• When performing the above operations, you can
automatically detect zero-crossing points, or display a
grid (vertical lines) and edit according to BPM values or
beats
1–1: Sample Edit
1–1a: Multisample Select (MS)
Multisample Select [0000…3999]
Selects the multisample that contains the sample you wish to
edit.
Keyboard
For more information, please see “0–1a: Multisample Select
(MS)” on page 574.
1–1b: Index, Sample Select, Range
Index [xxx (001…128)/yyy (001…128)]
Selects the index of the sample you wish to edit. Your
editing will affect the sample of the index that you select
here, and the waveform will appear in the Sample
waveform display (0–1a).
Note: An index can also be selected by holding down the
ENTER button and playing a note on the keyboard. The
index that includes this note will be selected. The key you
played will be the base key, and will be displayed in green in
the keyboard graphic. (“Keyboard” 0–1a)
Sample Select [----: ---No Assign----,
00000…15999]
Range [C–1…B9 – C–1…B9)
This shows the sample number and name for the selected
index, and the range. If you modify “Sample Select,” the
sample you specify here will be assigned to this index (0–
1b). The range of the index is shown at the right.
1–1c: Sample waveform display
Sample waveform display
This displays the waveform of the selected sample. The
horizontal axis is the sample address (time axis), and the
vertical axis is the sample level.
In the following diagram, “a” indicates the entire sample.
“b” indicates the portion of the entire sample that is shown in
“c”. As you zoom-in on the time axis, this shows you where
the magnified portion lies within the overall sample. You can
use the ZOOM buttons to magnify (zoom-in) or shrink
(zoom-out) the portion shown in the “c” waveform display.
If you have selected a stereo multisample or sample, the L
channel and R channel of the sample data will be shown
above and below.
1–1PMC
1–1e 1–1f
1–1a
1–1b
1–1c
1–1d
 Loading...