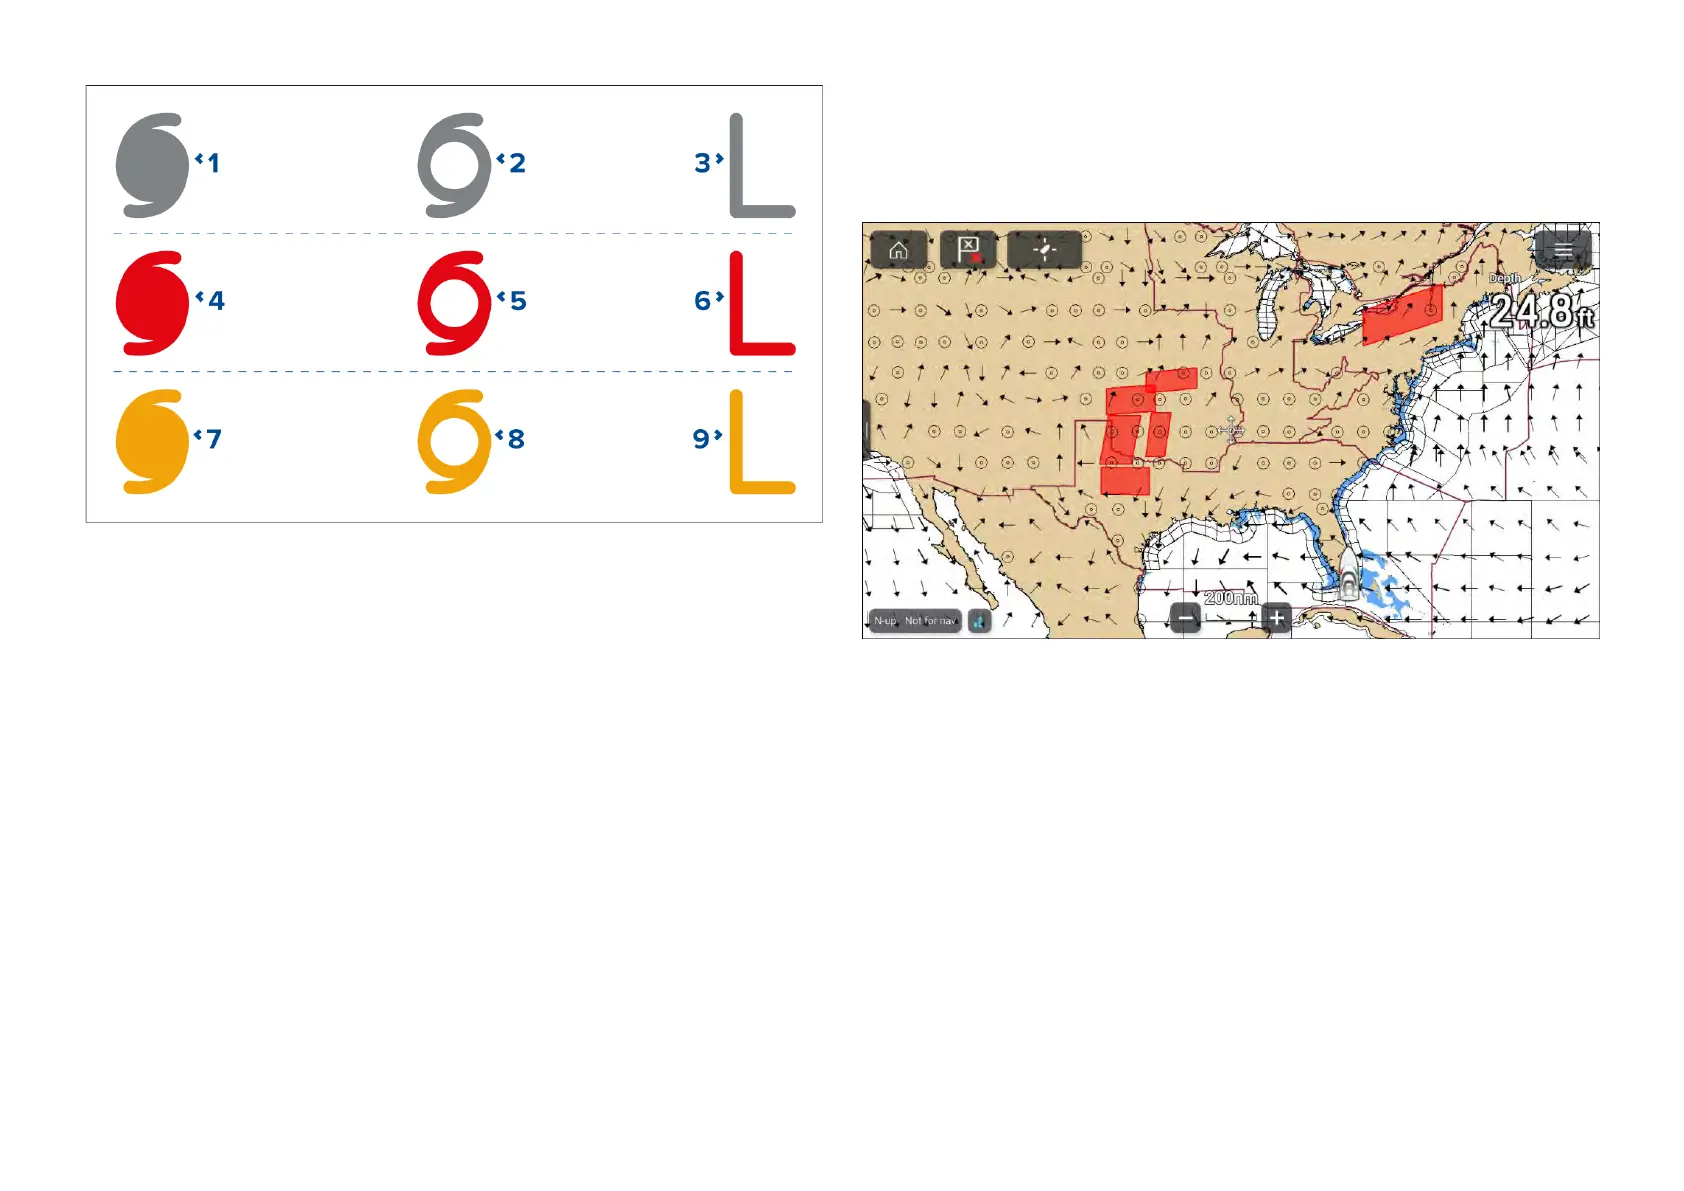
•1,2and3representhistoricaldata.
•4,5and6representcurrentdata.
•7,8and9representforecastdata.
•1,4and7representahurricane(category1to5).
•2,5and8representatropicalstorm.
•3,6and9representatropicaldisturbance
,tropicaldepression.
Stormdataisavailablefromthecontextmenuwhenasymbolisselected.
Surfacewindfields(windradii)areshownusingcoloredshaperepresenting
thewindfieldareaandspeed.
•Pink—windspeed=64knotsorgreater.
•Orange—windspeed=50knotsorgreater.
•Y ellow—windspeed=34knotsorgreater.
Thestormcastlayercanbeenabledanddisabledfromthe[Weatherlayers]
menu:[Menu>Weatherlayers>Stormcast].
Thestormtrackslayercanbeenabledanddisabledfromthe[Weather
layers]menu:[Menu>Weatherlayers>Stormtracks].
17.11WindandWatchboxlayers
Thewindlayerusesarrowsorbarbstoidentifywinddirectionandspeed.
Thewatchboxlayerusesredpolygonstoidentifyareaswheresevere
weatherisoccurringorforecastwithinaspecifiedrange.
Windarrows
Thedirectionofthearrowsindicatesthewinddirectionandthesizeofthe
arrowindicateswindspeed,thelargerthearrowthegreaterthewindspeed.
Whereconditionsarecalmacircularsymbolisused.
Windbarbs
Windbarbsidentifywinddirectionandspeed.
Barbsprovideamoreaccuratespeedidentificationthanarrows.
242

 Loading...