GUI Reference
R&S
®
ZNB/ZNBT
289User Manual 1173.9163.02 ─ 55
Measured quantities and display formats
The analyzer allows arbitrary combinations of display formats and measured quantities
(see Chapter 6.2, "Meas Softtool", on page 255). Nevertheless, to extract useful infor-
mation from the data, it is important to select a display format which is appropriate to
the analysis of a particular measured quantity.
An extended range of formats is available for markers. To convert any point on a trace,
create a marker and select the appropriate marker format (see "Marker Format"
on page 363). Marker and trace formats can be applied independently.
Background information
Refer to the following sections:
●
Chapter 5.2.3, "Trace Formats", on page 106
●
Chapter 5.2.3.3, "Measured Quantities and Trace Formats", on page 113
dB Mag
Selects a Cartesian diagram with a dB scale of the vertical axis to display the magni-
tude of the complex measured quantity.
Properties: The stimulus variable appears on the horizontal axis, scaled linearly. The
magnitude of the complex quantity C, i.e. |C| = sqrt ( Re(C)
2
+ Im(C)
2
), appears on the
vertical axis, scaled in dB. The decibel conversion is calculated according to dB
Mag(C) = 20 * log(|C|) dB.
Application: dB Mag is the default format for the complex, dimensionless S-parame-
ters. The dB-scale is the natural scale for measurements related to power ratios (inser-
tion loss, gain etc.).
Tip (alternative formats): The magnitude of each complex quantity can be displayed
on a linear scale. It is possible to view the real and imaginary parts instead of the mag-
nitude and phase. Both the magnitude and phase are displayed in the polar diagram.
Remote command:
CALCulate<Chn>:FORMat MLOGarithmic
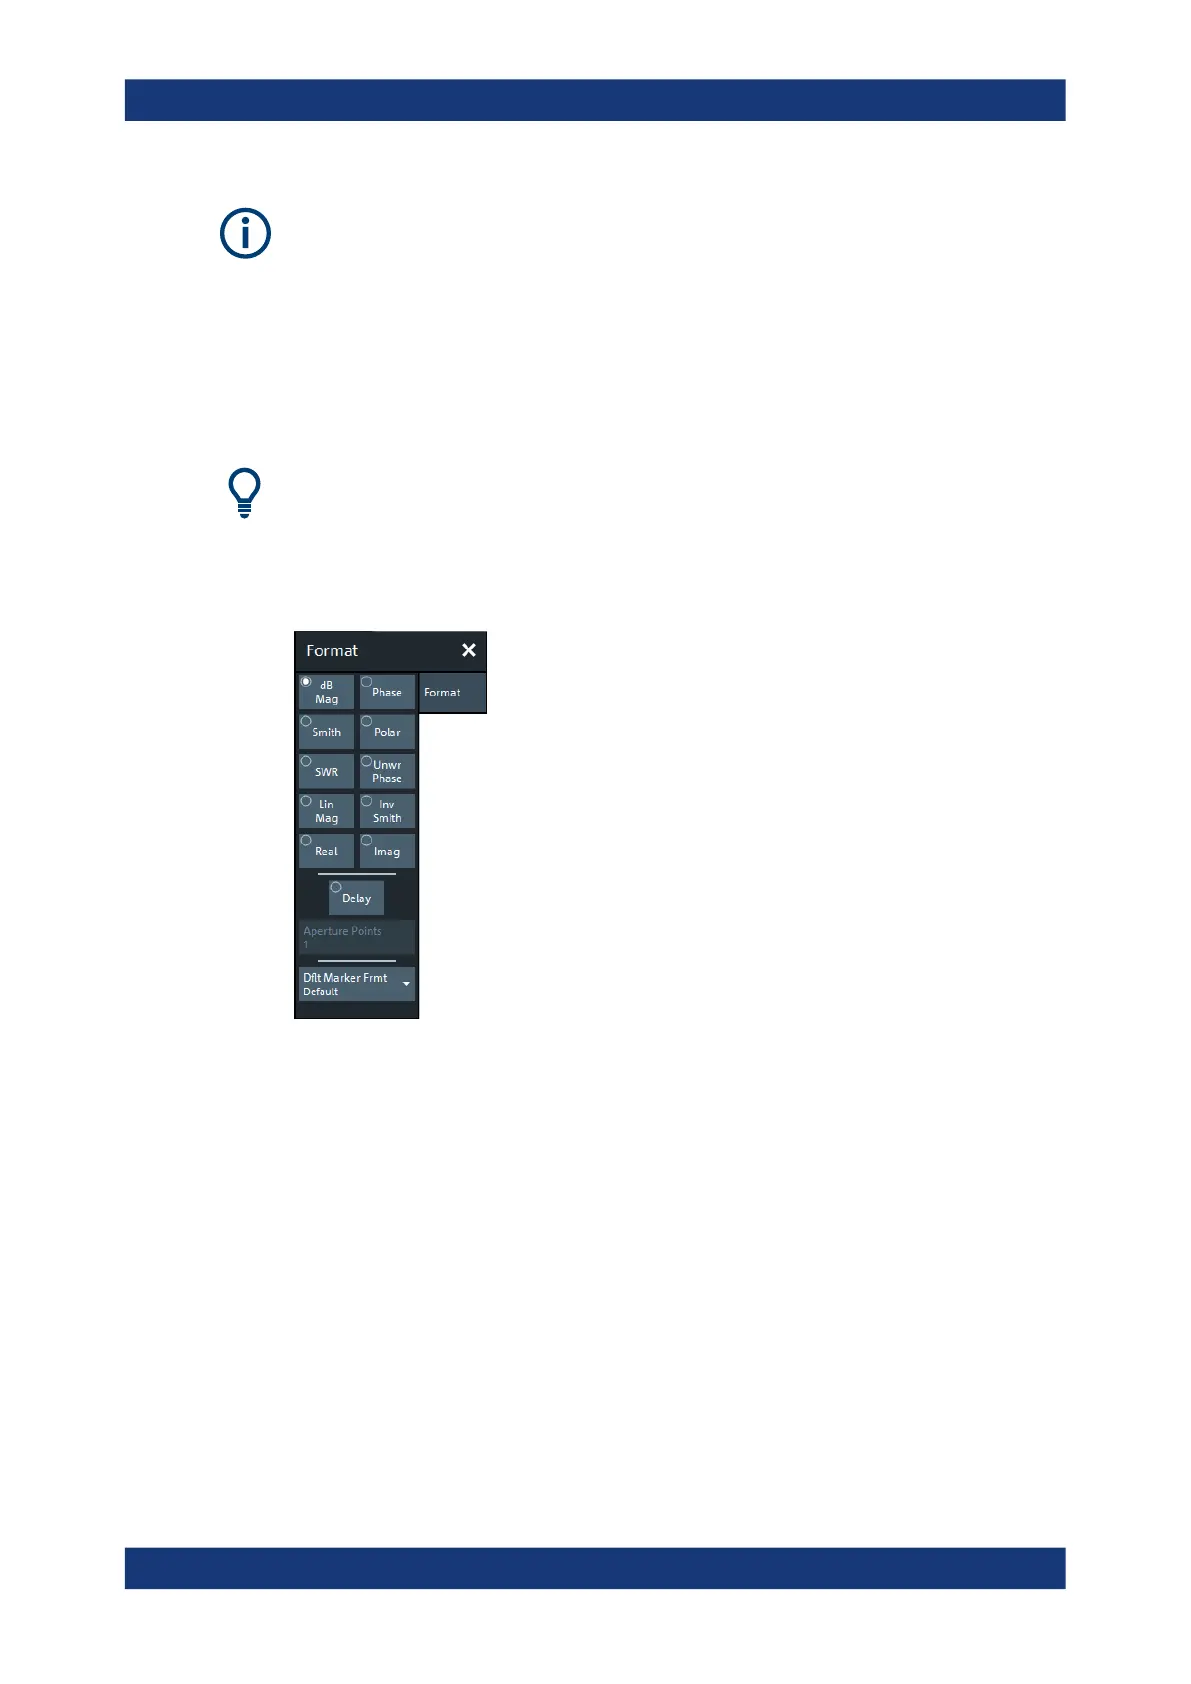
Format Softtool

 Loading...


