GUI Reference
R&S
®
ZNB/ZNBT
324User Manual 1173.9163.02 ─ 55
6.5.8.1 Controls on the Trace Statistics Tab
The "Evaluation Range..." button opens the "Evaluation Range" dialog (see Chap-
ter 6.5.8.2, "Evaluation Range Dialog", on page 328).
The "Decimal Places..." button opens the "System Config" dialog to define the (maxi-
mum) number of fractional digits for setting values and measurement results. See also
"User Interface Tab" on page 702..
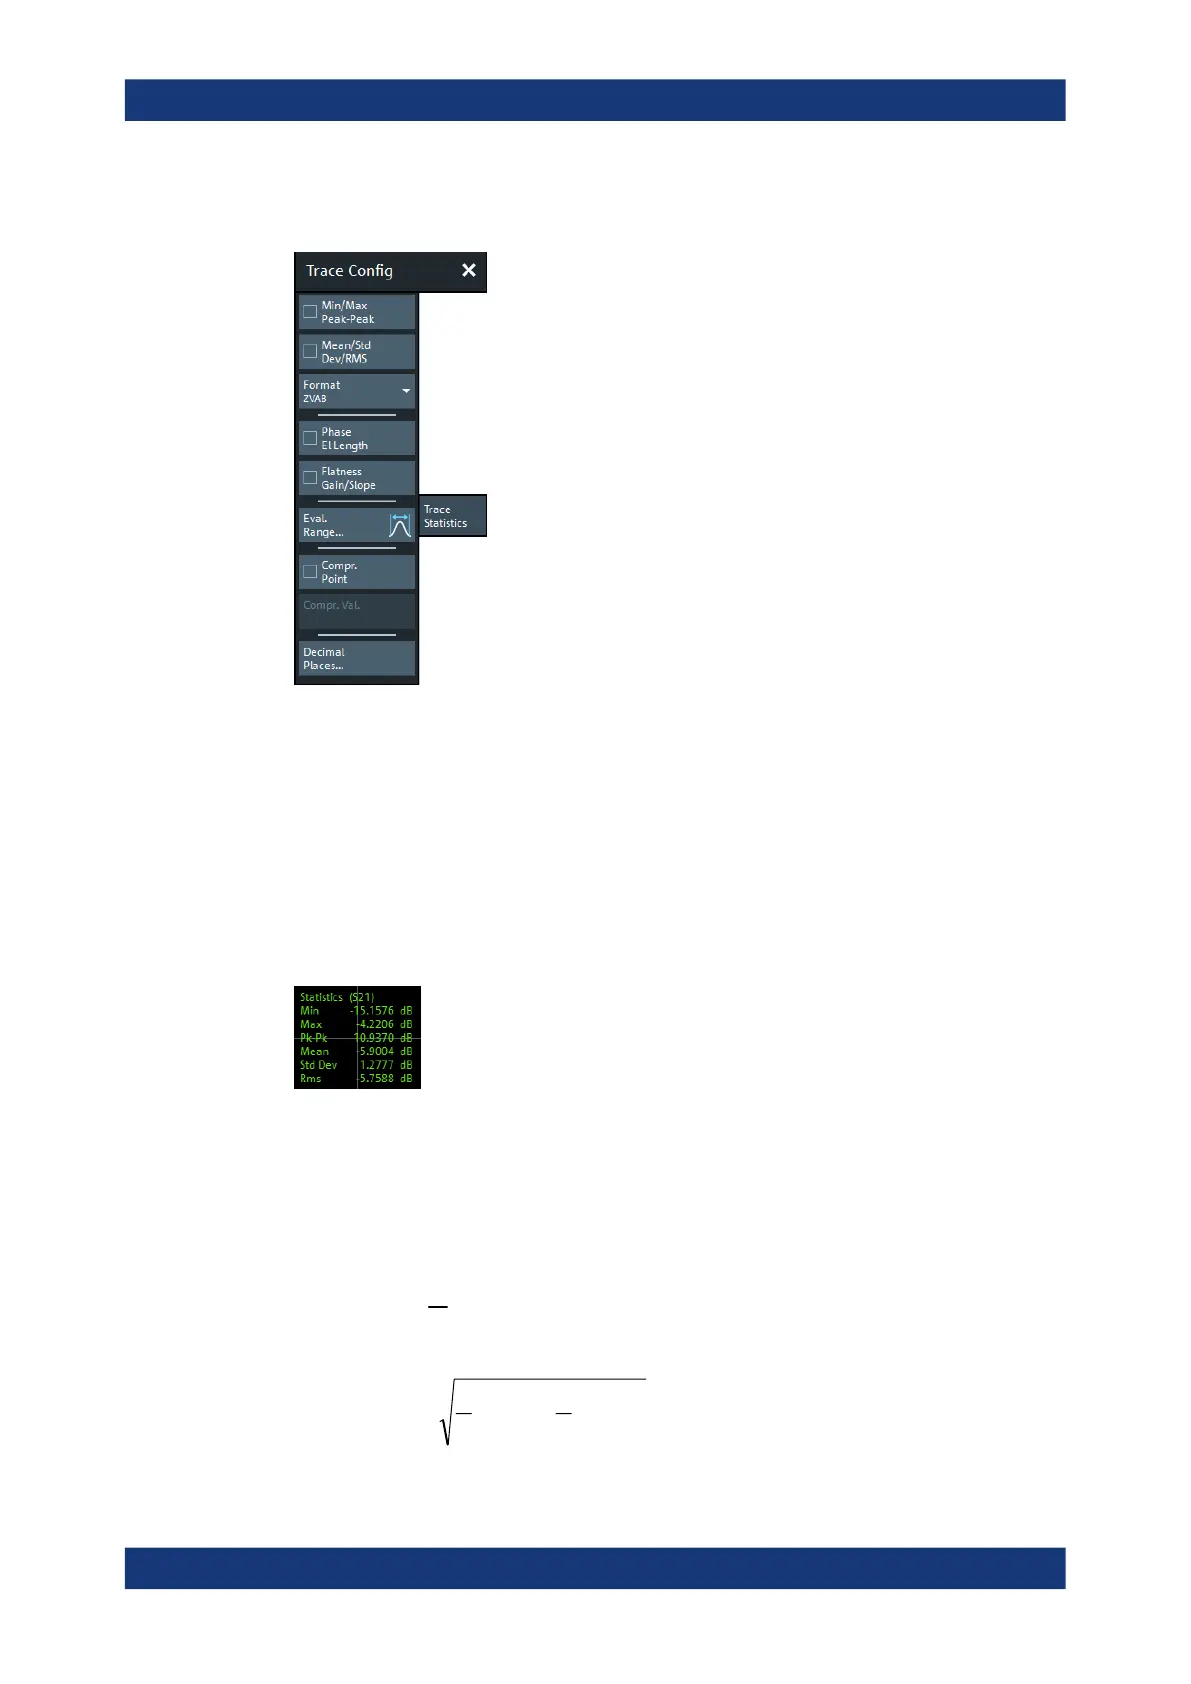
Min/Max/Peak-Peak, Mean/Std Dev/RMS
The upper two softkeys in the "Trace Statistics" tab display or hide groups of statistical
results. The values are based on all response values of the trace in the selected evalu-
ation range ("Evaluation Range...").
Suppose that the trace in the evaluation range contains n stimulus values x
i
and n cor-
responding response values y
i
(measurement points). The statistical values are
obtained as follows:
●
"Min" and "Max" are the largest and the smallest of all response values y
i
.
●
"Pk-Pk" is the peak-to-peak value and is equal to the difference "Max"–"Min"
●
"Mean" is the arithmetic mean value of all response values:
n
i
i
y
n
Mean
1
1
●
"Std Dev" is the standard deviation of all response values:
n
i
n
i
ii
y
n
y
n
DevStd
1
2
1
)
1
(
1
..
●
"RMS" is the root mean square (effective value) of all response values:
Trace Config Softtool

 Loading...


