Getting Started
R&S
®
ZNB/ZNBT
57User Manual 1173.9163.02 ─ 55
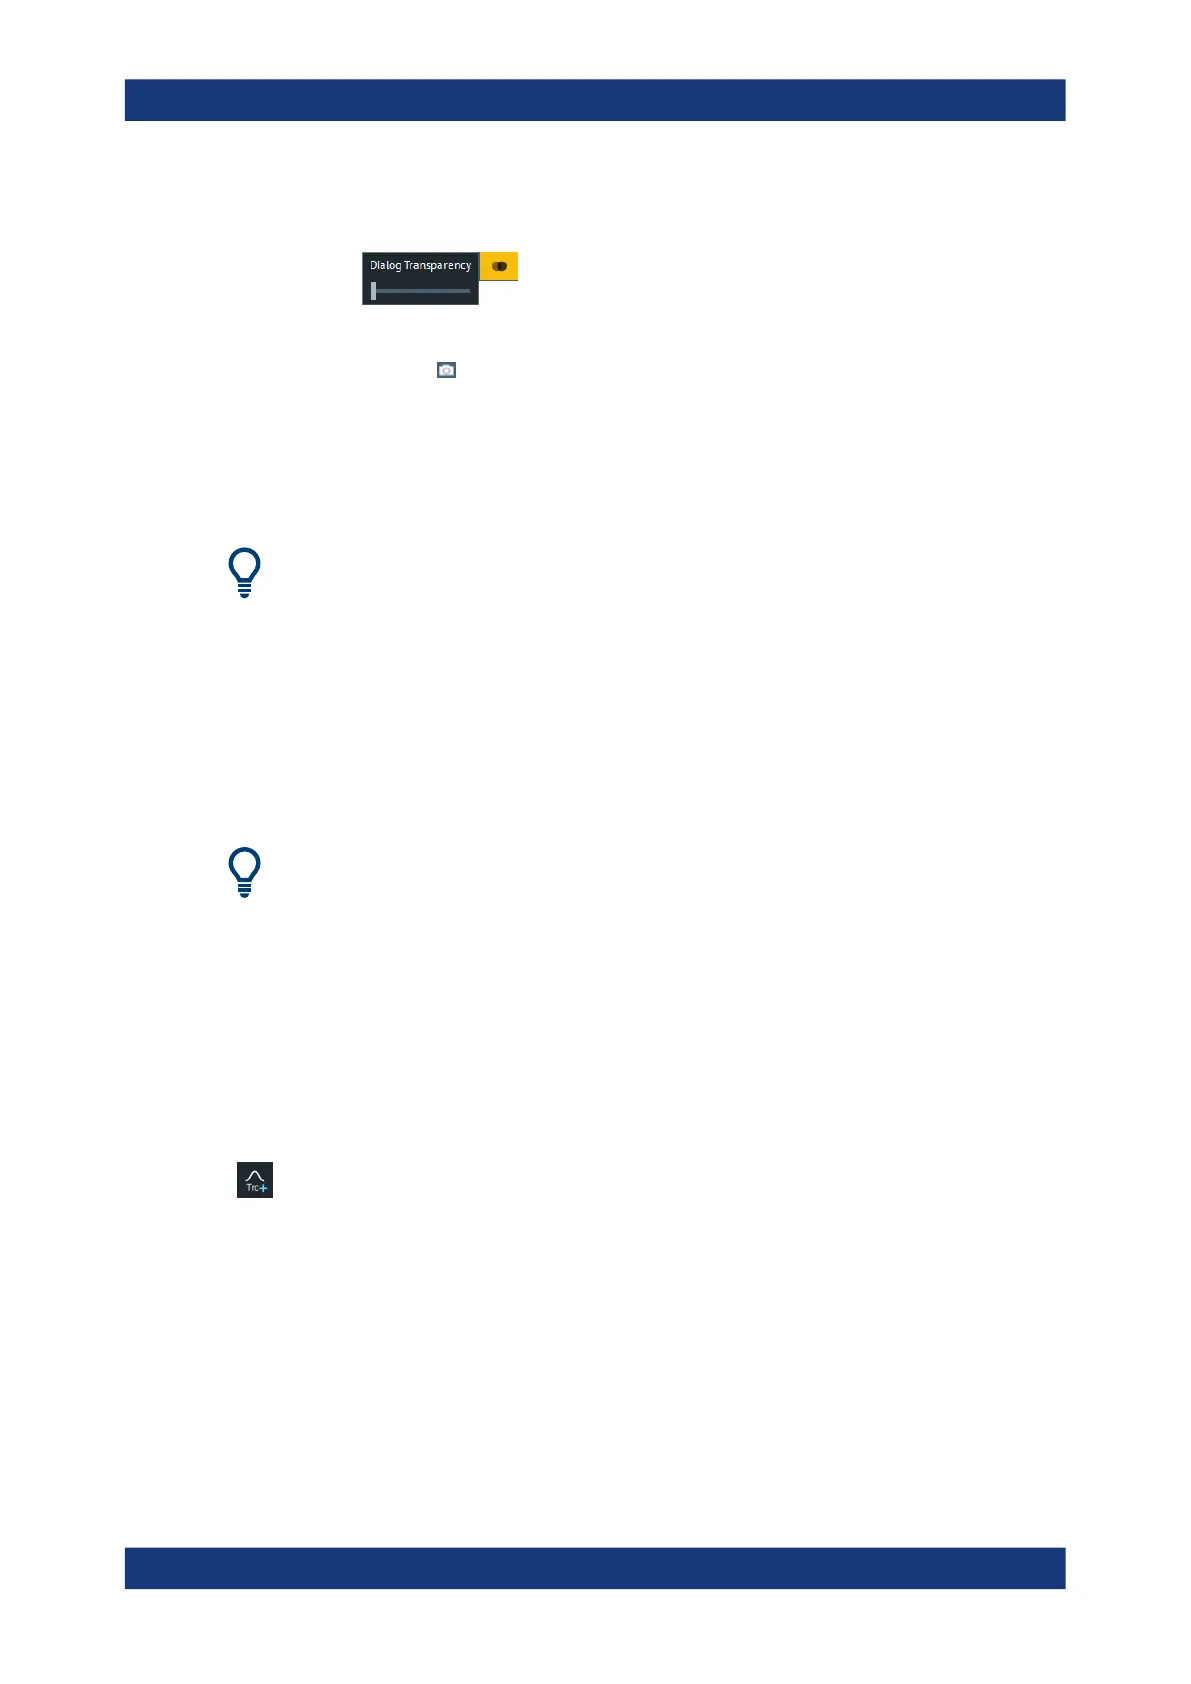
– Use the "Dialog Transparency" function to make the display elements behind
the dialog visible.
Note: The "Dialog Transparency" is a global setting, i.e. it applies to all dialogs.
–
Use the icon to create a screenshot of the dialog.
●
Drag and drop the lower right corner of the dialog to modify its size.
●
Some dialogs are subdivided into tabs, containing groups of related settings. Acti-
vate a tab to access those settings.
See also Chapter 5.2.2.1, "Immediate vs. Confirmed Settings", on page 103.
The Help system provides useful information about each dialog's specific settings.
Select "Help" to open the Help.
4.3.4 Handling Diagrams, Traces, and Markers
The analyzer displays measurement results as traces in rectangular diagrams. Markers
are used to read specific numerical values and to search for points or regions on a
trace. The following section presents some of the graphical tools the R&S ZNB/ZNBT
provides for trace and marker handling.
For further reference
Refer to Chapter 5, "Concepts and Features", on page 79 to learn more about traces,
channels, and screen elements.
4.3.4.1 Adding New Traces and Diagrams
A new trace is required if you want to measure and display an additional quantity.
Typical scenario: The transmission coefficient S
21
is measured as described in Chap-
ter 4.4.1, "Transmission S-Parameter Measurement", on page 70. A trace is added to
display the reflection coefficient S
11
for comparison.
To create a trace:
1. Drag the "Trc+" icon from the toolbar into a diagram.
The diagram changes its color scheme and contents as shown below.
Operating the Instrument

 Loading...


