GUI Reference
R&S
®
ZNB/ZNBT
422User Manual 1173.9163.02 ─ 55
After all these calibration steps have been completed, the resulting system error cor-
rection can be calculated and applied.
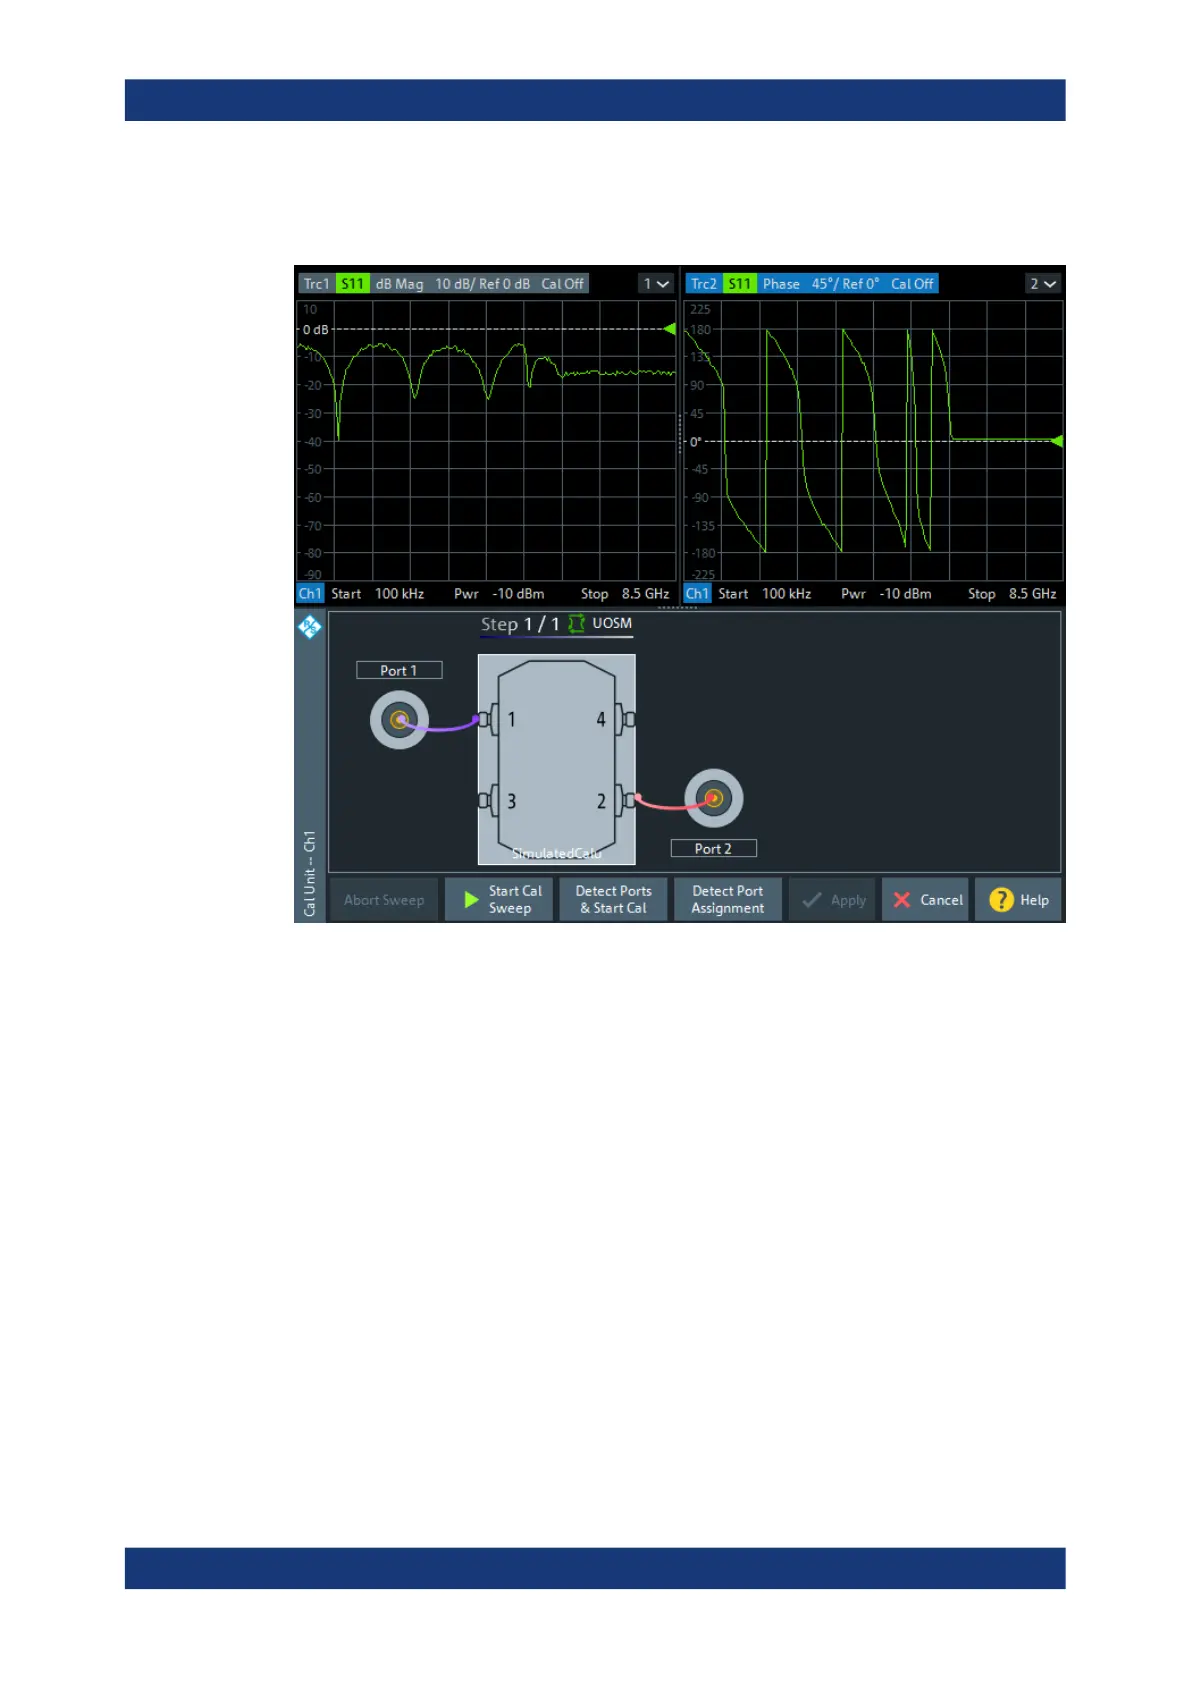
In the upper part of the "Cal Unit" screen, the R&S ZNB/ZNBT shows the calibration
sweep diagrams for the currently measured S-parameter. The lower part visualizes the
active port assignment and the measurement progress.
Calibration Sweep Diagrams
During the calibration sweep, each diagram contains a single S-parameter trace and a
typical result trace for the measured calibration standard.
If switch matrices are involved, a sweep is performed for every possible signal path
and for each of these paths a separate S-parameter trace is shown (see Chap-
ter 5.7.27.5, "Multiple Paths and Calibration", on page 251).
Cal Softtool

 Loading...


