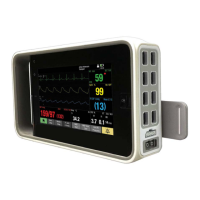
ECG
3.SelectaleadgroupfromtheLeadslist.Choicesare:
●ST:TheleadsdisplayedintheSTwindow.
●Anterior:Theleadsbelongingtothisleadgroup.
●Inferior:Theleadsbelongingtothisleadgroup.
●Lateral:Theleadsbelongingtothisleadgroup.
●Display:Theleadsassociatedwiththewaveformsselectedfordisplay.
ReviewingSTtrends
Thisselectionisnotavailablewithcombinationmonitoring.
YoucanreviewSTtrendvaluesandcompareSTtrendrelatedQRScomplexeswith
realtimeQRScomplexesbyusingtheyellow-coloredcursor.Thecurrenttimeofthe
cursorisdisplayedabovethecursor.Eachyellow-coloredtrendvalueisdisplayednext
tothecursorandSTtrendrelatedQRScomplexesaredrawnintheQRSwindows
withthecolorgray.
1.SelecttheSTparameterwindow.
2.SelectTrendView.
3.SelecttherightorleftarrowabovetheQRSviewtomovetheSTcursor.
PrintinganSTtrendreport
Thisselectionisnotavailablewithcombinationmonitoring.
ThelengthoftheSTtrendreportisthesameastheTrendScalessettingforSTtrends.
1.SelecttheSTparameterwindow.
2.SelectTrendView.
3.SelectPrintPage.
4.Tostopprinting,selectCancelPrinting.
Ischemicburden
Thisfeatureisnotavailablewithcombinationmonitoring.
IschemicburdenprovidesadditionalinformationaboutthedegreeofSTchanges
duringacertaintimeperiod.Itisavisualizationofischemia.InSTTrendView,thearea
betweentheSTtrendandtheischemicburdenlimitiscoloredyellow:
MyocardialischemiaappearsintheECGasanSTsegmentdeviationfromthe
isoelectricline(ISOpoint).TheSTsegmentgenerallyrisesabovetheisoelectriclinein
thepresenceoftransmuralischemiaandisbelowtheisoelectriclineinthepresenceof
subendocardialischemia.TheSTmeasurementsaredisplayedasanumericvalue:a
negative(-)numberindicatesSTdepression;apositivenumberindicatesSTelevation.
2062971-001CARESCAPEModularMonitors187
 Loading...