Pulseoximetry
SaturationSeconds,”wherepointsequalsSpO
2
percentagepointsatoroutsidethe
limit,andsecondsequalsthenumberofsecondsSpO
2
remainsatthatpointoutside
thelimit.
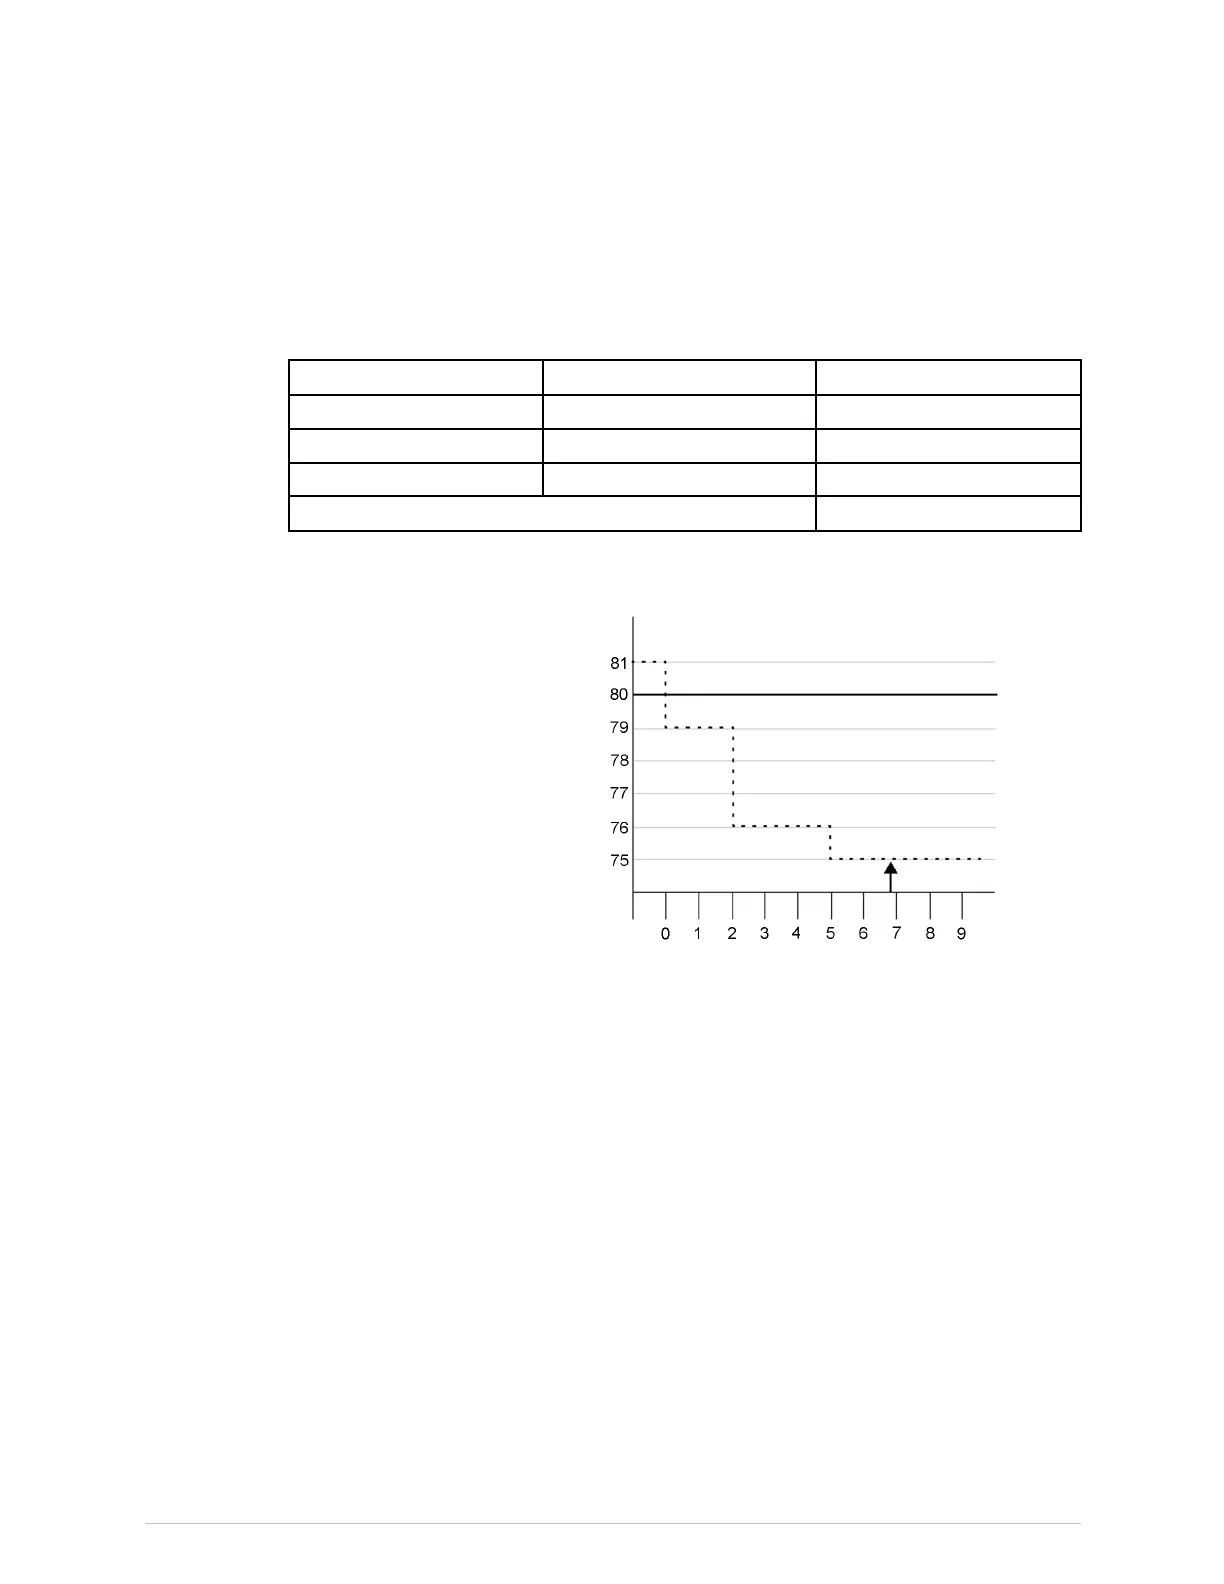
ThefollowingtabledemonstratesthealarmresponsetimewithaSaturationSeconds
limitsetat30andalowlimitof80%.TheSpO
2
leveldropsto79%(2points)and
remainstherefortwoseconds.Thenitdropsto76%(5points)forthreeseconds,and
thento75%(6points)fortwoseconds.TheresultingSaturationSecondsare:
SpO
2
saturationchangeClocksecondsSaturationSeconds
2x2=
4
5x3=
15
6x2=12
TotalSaturationSeconds
31
Afterapproximatelysevenseconds,thealarmwouldsoundbecause30Saturation
Secondswouldhavebeenexceeded(arrowinthefollowinggure).
SpO
2
saturation%
Seconds
SaturationSecondsalarmresponseexample
Saturationlevelsmayuctuateaboveandbelowanalarmlimit,re-enteringthe
acceptablerange(non-alarmrange)severaltimes.Duringsuchuctuation,the
monitorintegratesthenumberofSpO
2
saturationpoints,bothpositiveandnegative,
untileithertheSaturationSecondslimitisreachedorthesaturationlevelreturnsto
withinthenormalrangeandremainsthere.
WhenanSpO
2
saturationvalueexceedsanalarmlimit,apiechart(circulargraph)in
theSpO
2
parametermenubeginstollinaclockwisedirection.Assecondspassand
thevalueiscomparedagainstthealarmlimitsandtheSaturationSecondssetting,the
chartllsproportionately.Whenthepiechartiscompletelylled,indicatingthatthe
SaturationSecondslimithasbeenreached,analarmsounds.WhentheSpO
2
valueis
withinthesetlimits,theSaturationSecondspiechartemptiesinacounterclockwise
direction.
ShowingtheSaturationSecondsintheSpO
2
parameterwindow
NOTE
PDMandTRAMwithprimarySpO
2
measurementandthe
Nellcoroptiononly.
212CARESCAPEModularMonitors2062971-001
 Loading...