Concepts and Features
R&S
®
ZNB/ZNBT
210User Manual 1173.9163.02 ─ 55
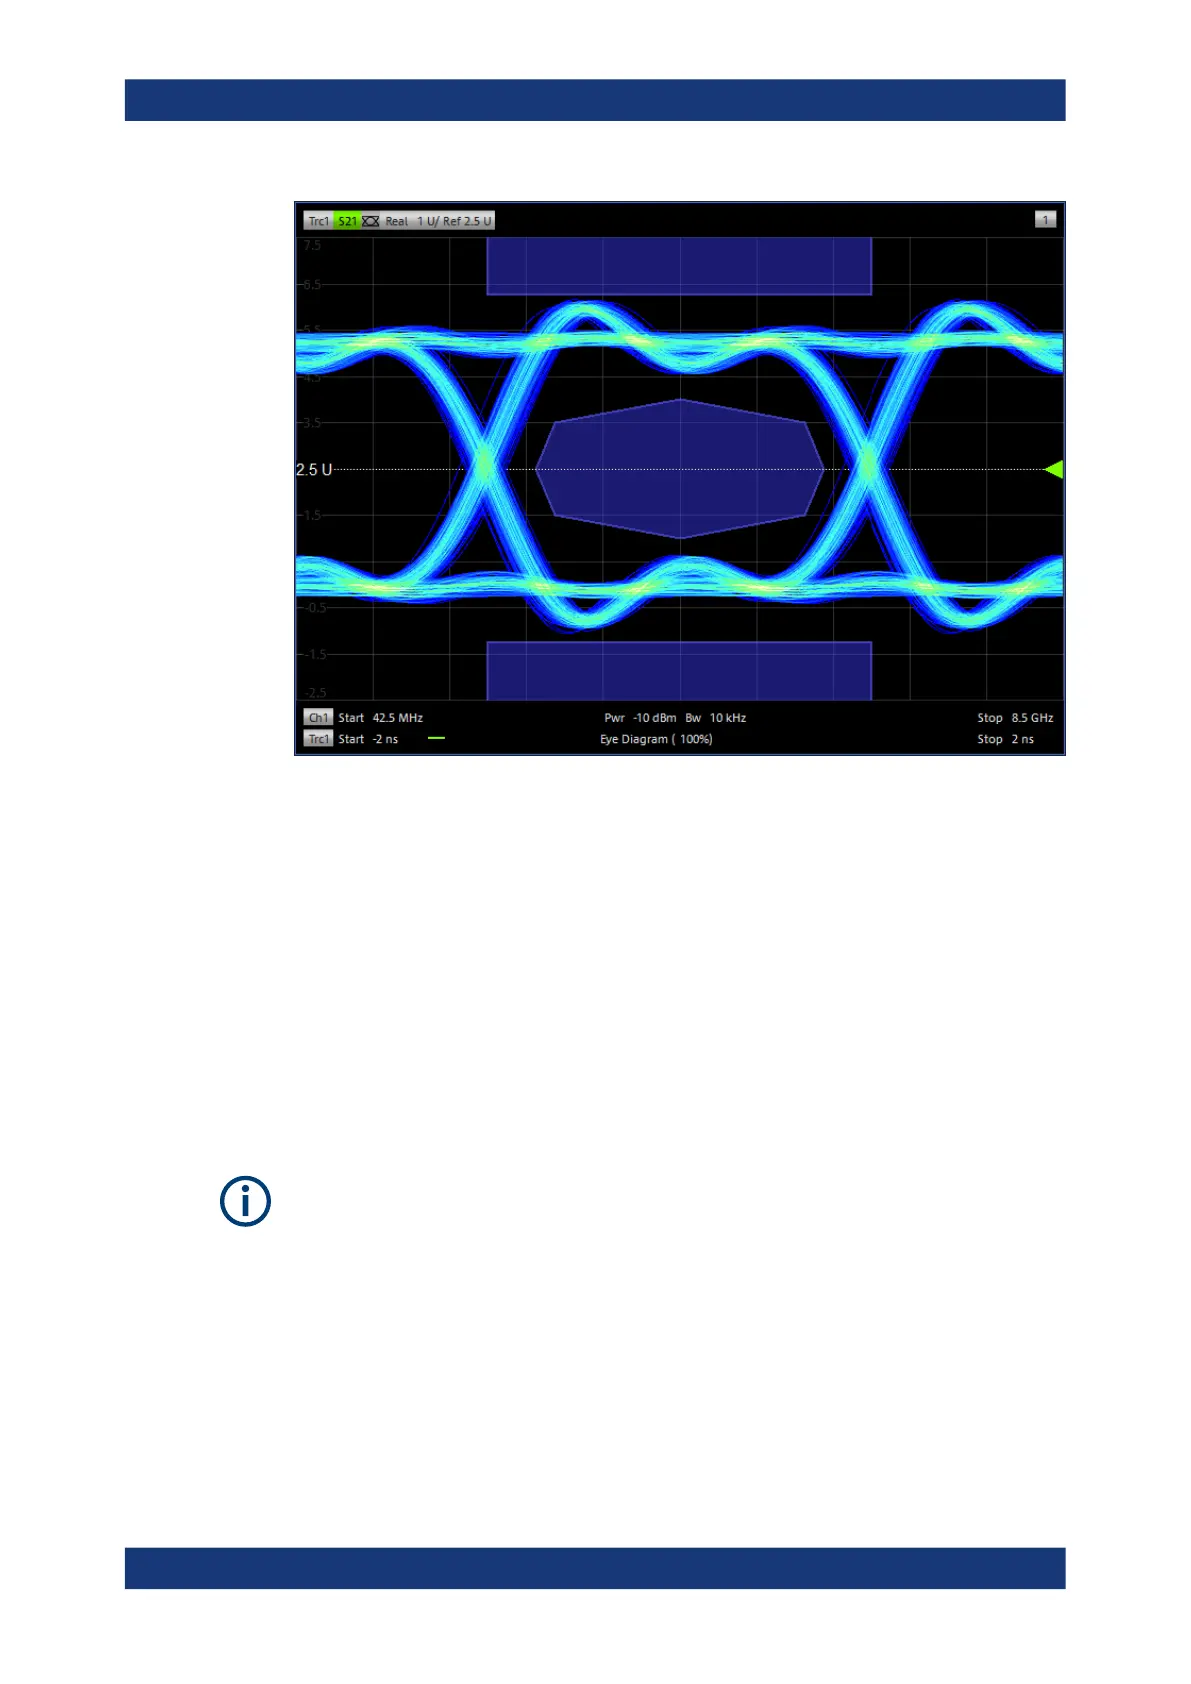
Figure 5-14: Eye Diagram (NRZ modulated)
The measurement proceeds as follows:
1. The analyzer performs a frequency sweep.
2. The impulse response is calculated based on the results of the preceding fre-
quency sweep.
3. With the impulse response calculated in step 2,
a) the eye diagram is simulated.
b) the Eye Diagram Results are calculated.
c) the Eye Mask Test is evaluated (if enabled).
4. In continuous sweep mode, go back to step 2
●
The simulation progress is shown in the channel list below the eye diagram
●
In continuous sweep mode, the analyzer keeps on sweeping while the eye diagram
is being simulated and evaluated
Eye Diagram Results
The properties of the simulated eye diagram can be displayed as an info field or expor-
ted to an ASCII file.
Optional Extensions and Accessories

 Loading...


