GUI Reference
R&S
®
ZNB/ZNBT
386User Manual 1173.9163.02 ─ 55
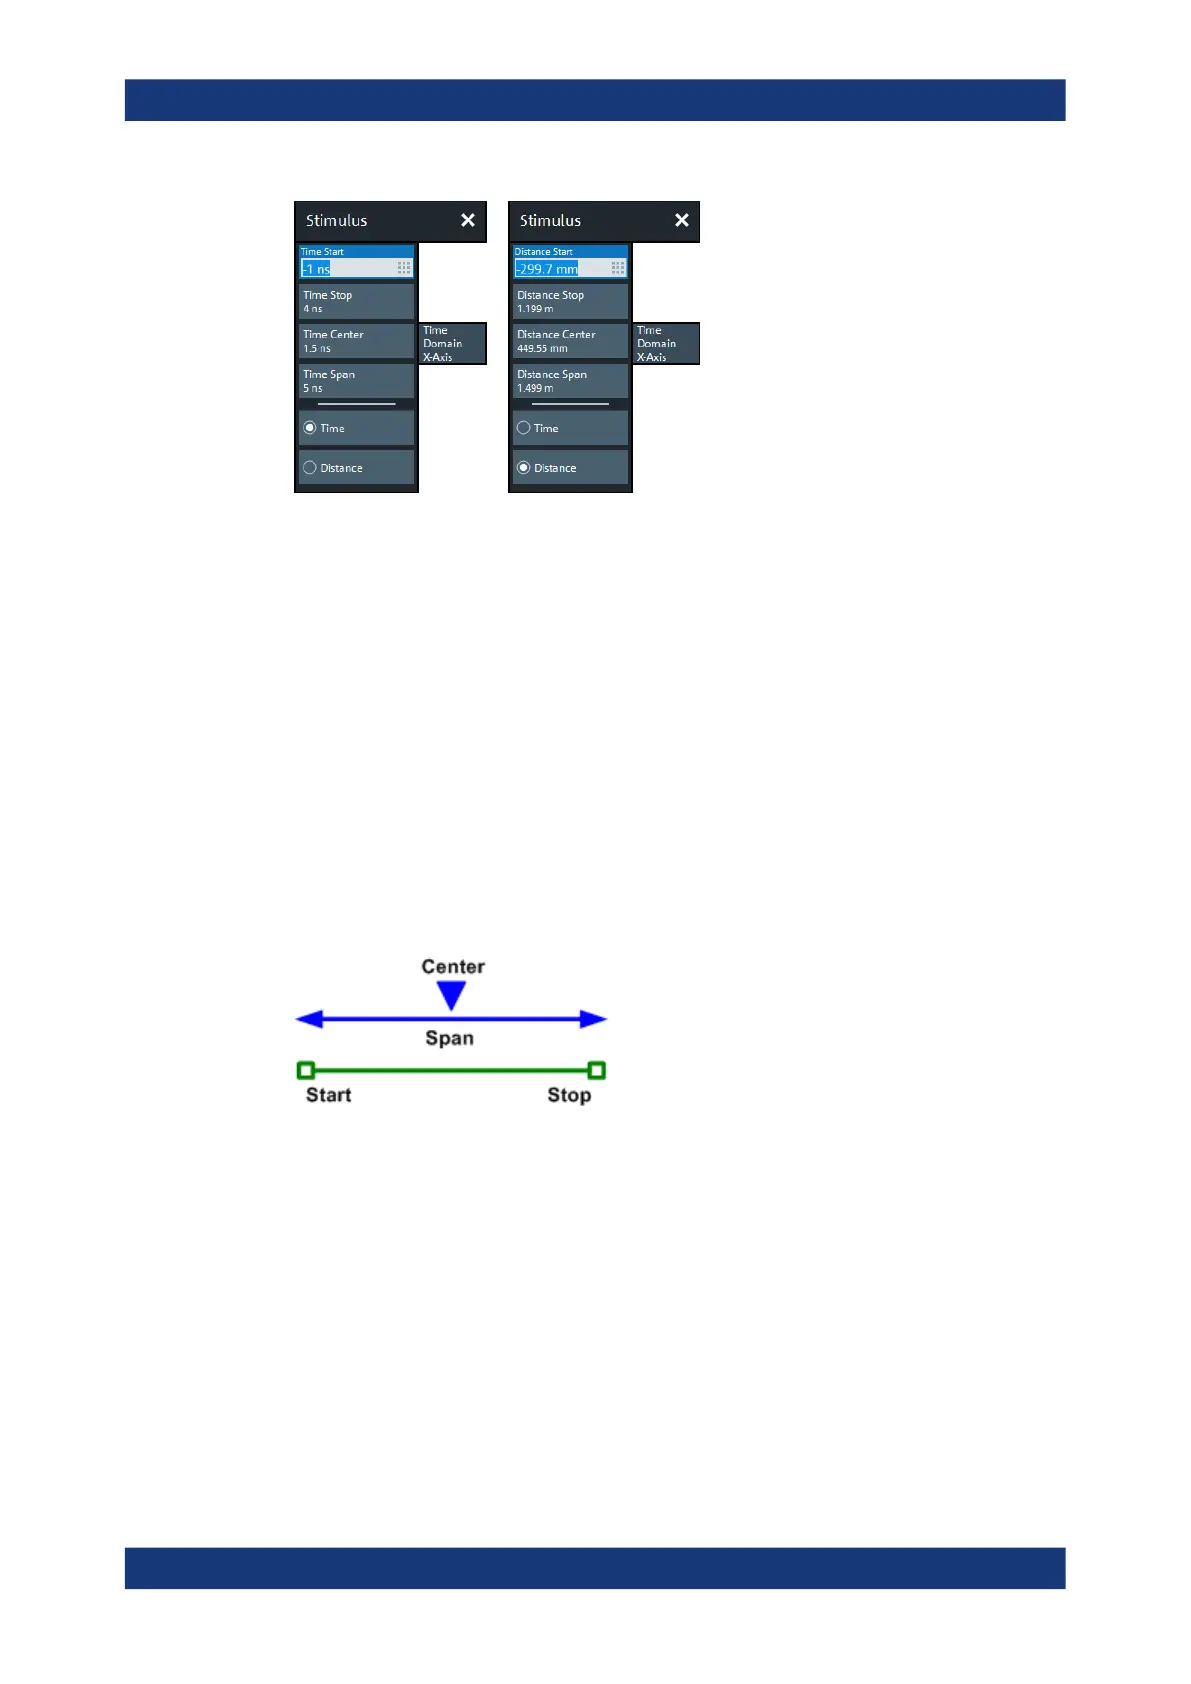
Figure 6-7: Stimulus > Time Domain X-Axis softtool tab
left = Time representation
right = Distance representation
Time Start / Time Stop / Time Center / Time Span
Defines the display range for the time domain trace in time representation (see "Time /
Distance" on page 387).
●
"Time Start" is the lowest displayed time and corresponds to the left edge of the
Cartesian diagram.
●
"Time Stop" is the highest displayed time and corresponds to the right edge of the
Cartesian diagram.
●
"Time Center" corresponds to the center of the Cartesian diagram, i.e. ("Time Start"
+ "Time Stop")/2.
●
"Time Span" corresponds to the diagram width, i.e. ("Time Stop" – "Time Start").
"Time Start" and "Time Stop" or "Time Center" and "Time Span" are alternative set-
tings.
Remote command:
CALCulate<Chn>:TRANsform:TIME:STARt
CALCulate<Chn>:TRANsform:TIME:STOP
CALCulate<Chn>:TRANsform:TIME:CENTer
CALCulate<Chn>:TRANsform:TIME:SPAN
Distance Start / Distance Stop / Distance Center / Distance Span
Defines the display range for the time domain trace in distance representation (see
"Time / Distance" on page 387).
"Distance Start" and "Distance Stop" or "Distance Center" and "Distance Span" are
alternative settings.
Stimulus Softtool

 Loading...


