GUI Reference
R&S
®
ZNB/ZNBT
618User Manual 1173.9163.02 ─ 55
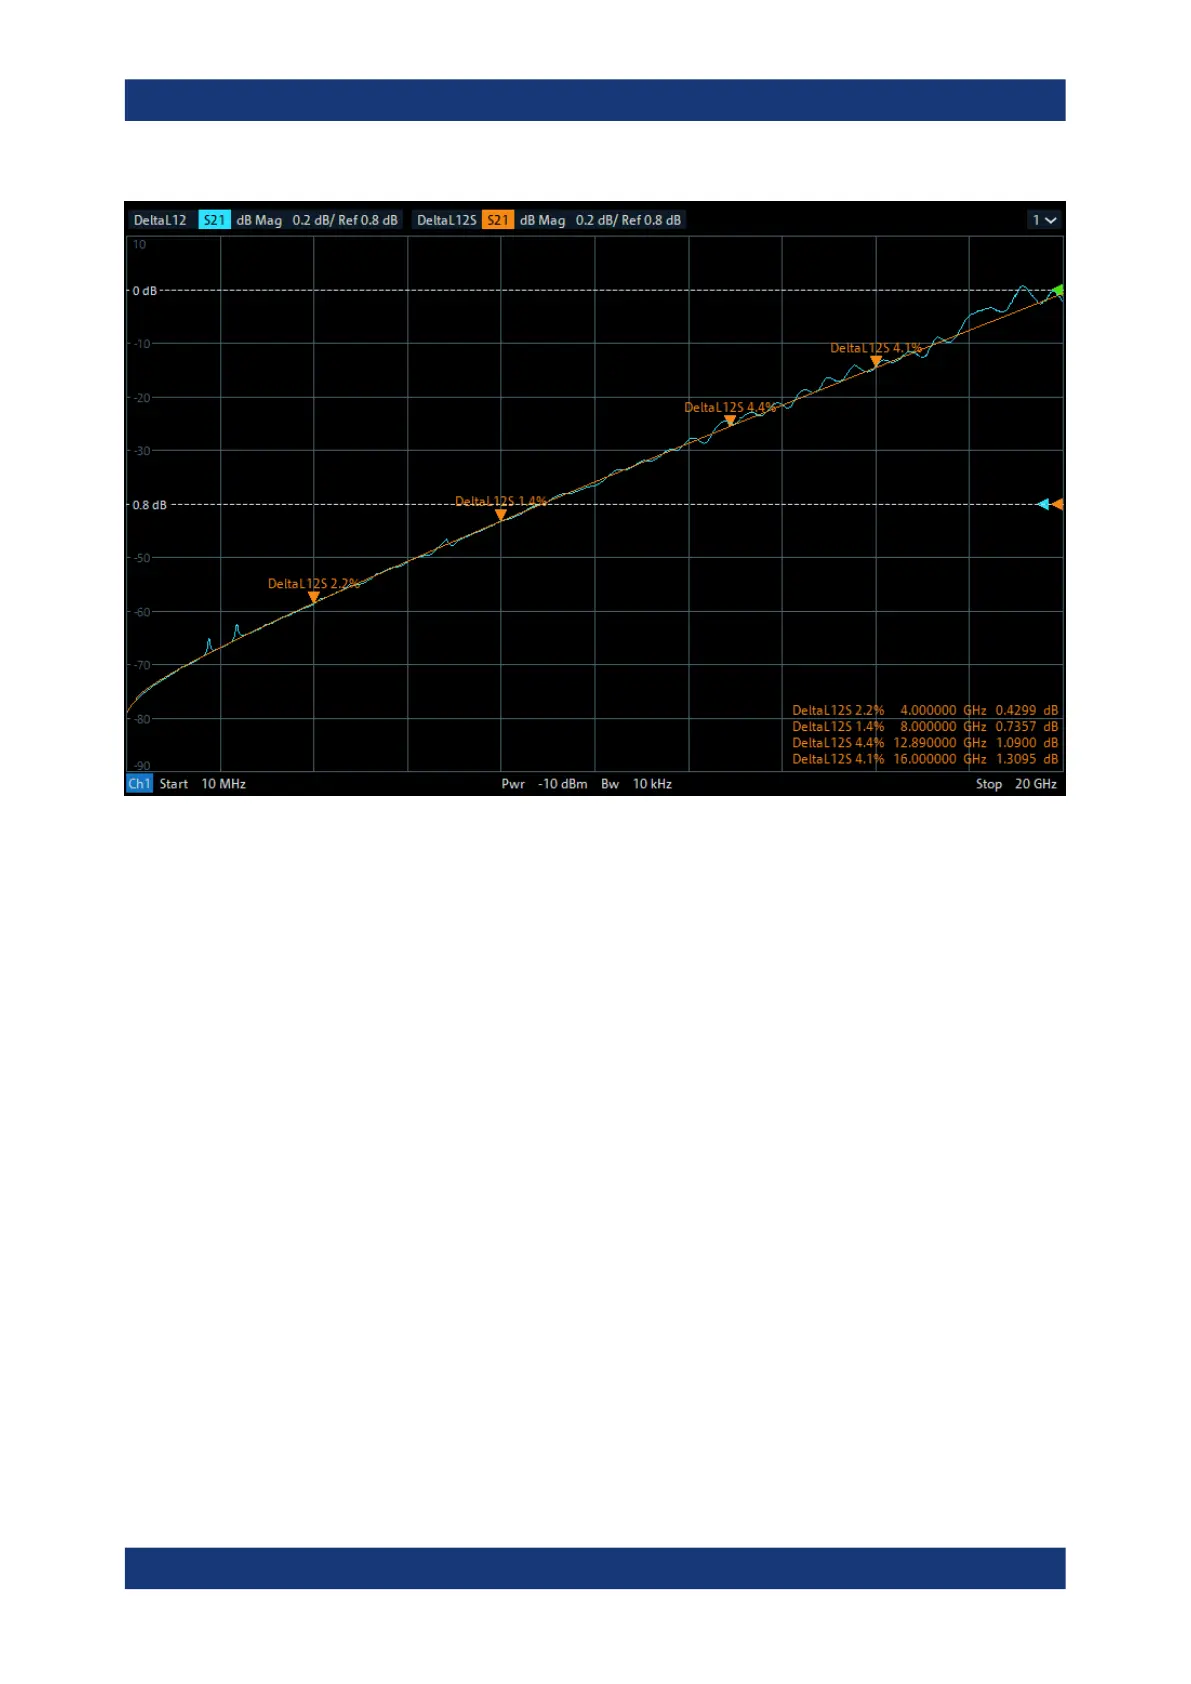
Figure 6-59: Method 2L results
Markers are added to the smoothed traces at the analysis frequencies. The marker
name indicates to which analysis pair it belongs and the computed Delta-L uncertainty.
Method 1L
For "Method 1L", the Delta-L diagram displays the following traces:
●
An insertion loss trace "L<i>" for each touchstone file L<i>.s<2|4>p (loaded or
measured) in the measurement cache
●
An additional trace "StdDev" representing the standard deviation of the 1L analysis
at the analysis frequencies
Offset Embed Softtool

 Loading...


