Lantronix SISPM1040-xxxx-L3 Web User Guide
33856 Rev. A https://www.lantronix.com/ 469
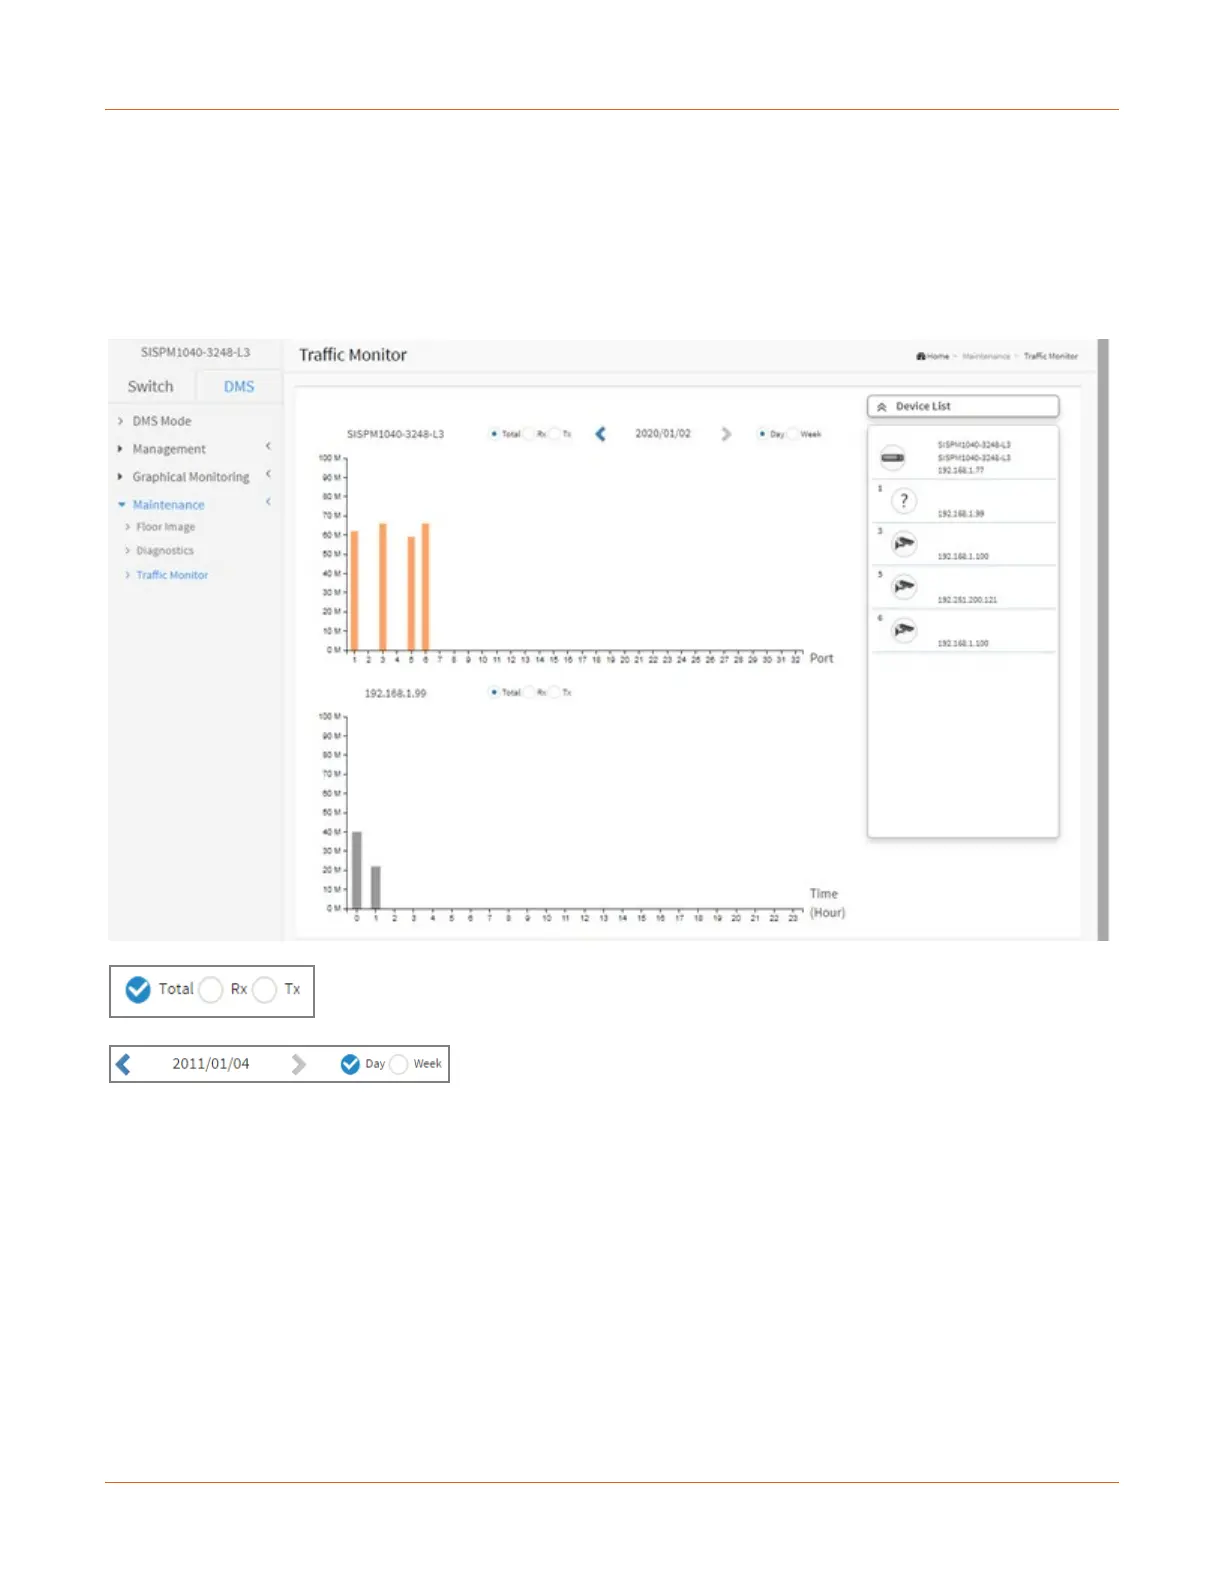
DMS > Maintenance > Traffic Monitor
This page displays a visual chart of network traffic of all the devices. Numbers are shown in Mbit/s.
To view the traffic of all the ports or just a specific port; click on a specific port on the traffic chart to reveal its
traffic during the day.
You can select to display a summary of a day's or a week's traffic by selecting the check circle on top. The same
applies to the selection of Rx Tx traffic. A single port's traffic is shown at the lower half of the screen.
Total / Rx / Tx: Select the set of data to be displayed. The default is Total.
< yy/mm/dd >: Select the date of data displayed.
Day / Week: Select a day’s worth of data or a week’s worth of data to be displayed.
Device List: Displays the set of discovered devices.
Throughput: Vertical axis shows the device throughput (e.g., 0 M-18000 M or 0 M-1200 M).
Port: Horizontal axis shows the switch port numbers.
Time (Hour): Horizontal axis shows the time elapsed in hours (0-23).
 Loading...