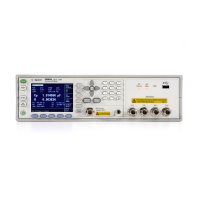
E5071C
1200
Next j
Make_Freq = freq_arry 'Sets the frequency data array.
End Function
Sub Data_Plot(vi As Long, Nop As Long, ErrTerm As String)
Range("B10:C" & Nop + 9 & "").Select 'Select the error coefficient.
Charts.Add
ActiveChart.ChartType = xlLineStacked 'Sets the chart type.
ActiveChart.SetSourceData Source:=Sheets("Error Term").Range("A9:C" & Nop + 9 & "") 'Sets the
error coefficient and displays the graph.
ActiveChart.Location Where:=xlLocationAsObject, Name:="Error Term"
ActiveChart.Axes(xlCategory).Select 'Select the formatting of X-axis.
With Selection
.TickLabelPosition = xlLow 'Displays the frequency values to low area.
End With
With ActiveChart
.HasTitle = True
.ChartTitle.Characters.Text = "Error Term " & ErrTerm 'Display the title.
End With
End Sub
Sub Set_sgm_tbl(vi As Long, Ch As String)
Dim Star1(2) As Double, Stop1(2) As Double, Pow1(2) As Double, If_bw1(2) As Double
Dim Segm As Integer, Nop1(2) As Integer, Num_of_tr1 As Integer
Dim i As Integer
Segm = 2
Star1(1) = Cells(3, 9) 'Sets the start frequency of segment 1 table.
Stop1(1) = Cells(3, 10) 'Sets the stop frequency of segment 1 table.
Pow1(1) = Cells(3, 11) 'Sets the power of segment 1 table.
If_bw1(1) = Cells(3, 12) 'Sets the ifbw of segment 1 table.
Nop1(1) = Cells(3, 13) 'Sets the nop of segment 1 table.
Star1(2) = Cells(4, 9) 'Sets the start frequency of segment 2 table.
Stop1(2) = Cells(4, 10) 'Sets the stop frequency of segment 2 table.
Pow1(2) = Cells(4, 11) 'Sets the power of segment 2 table.
 Loading...


