EasyManuals Logo

Agilent Technologies VEE Pro User Manual

Agilent Technologies VEE Pro
577 pages
To Next Page IconTo Next Page
To Previous Page IconTo Previous Page
Page #129 background imageLoading...
Page #129 background image
Chapter 2 103
Agilent VEE Programming Techniques
Debugging Programs in Agilent VEE
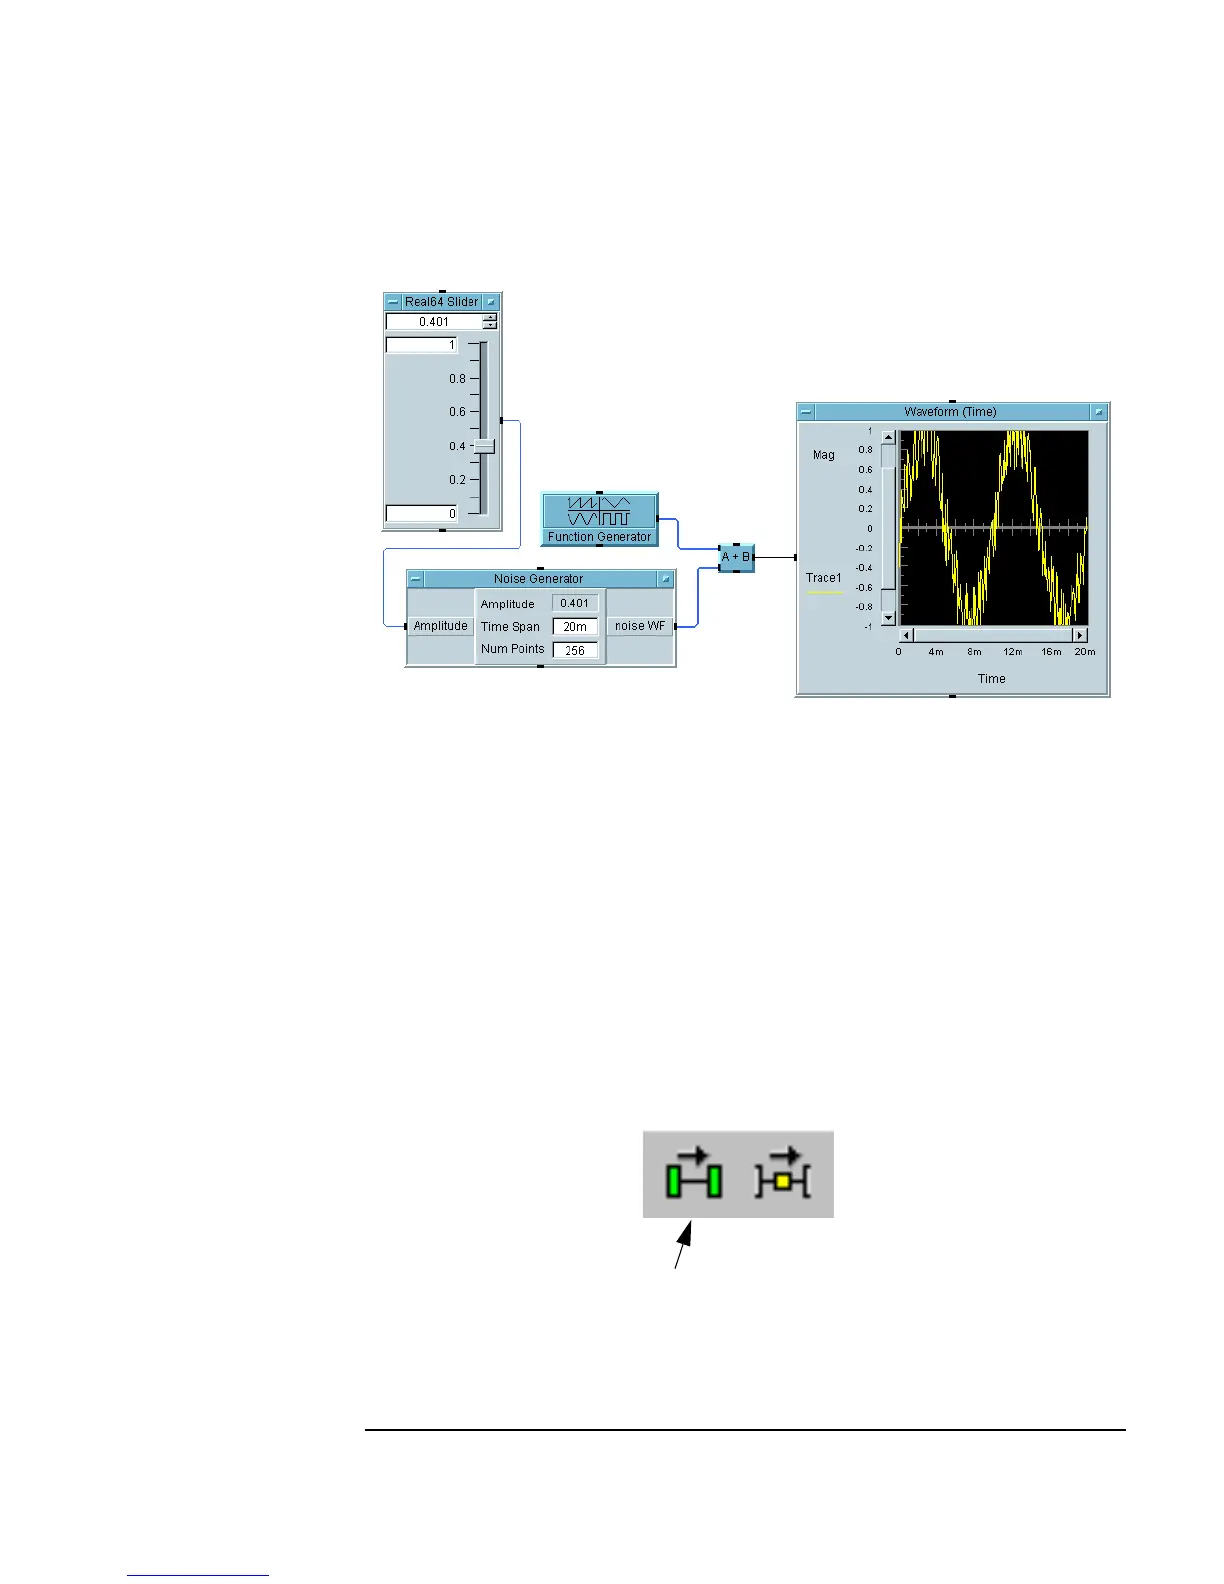
Figure 2-19. Data Flow in simple-program.vee
For example, in Figure 2-19, data moves from the Real64 Slider to
the
Noise Generator. The output from the Noise Generator and
the
Function Generator are input to the A+B object, and the results
are displayed in the
Waveform (Time) display.
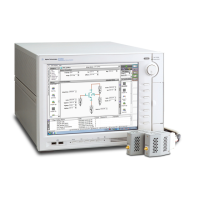
Showing Execution Flow
1. Click the Show Execution Flow button on the tool bar as shown in
Figure 2-20. (Or click
Debug ⇒ Show Execution Flow.)
Figure 2-20. Show Execution Flow
Show Execution Flow button on toolbar

Table of Contents

Questions and Answers:

Question and Answer IconNeed help?

Do you have a question about the Agilent Technologies VEE Pro and is the answer not in the manual?

Agilent Technologies VEE Pro Specifications

General IconGeneral
BrandAgilent Technologies
ModelVEE Pro
CategorySoftware
LanguageEnglish

Related product manuals