Chapter 4 197
Analyzing and Displaying Test Data
Customizing Test Data Displays
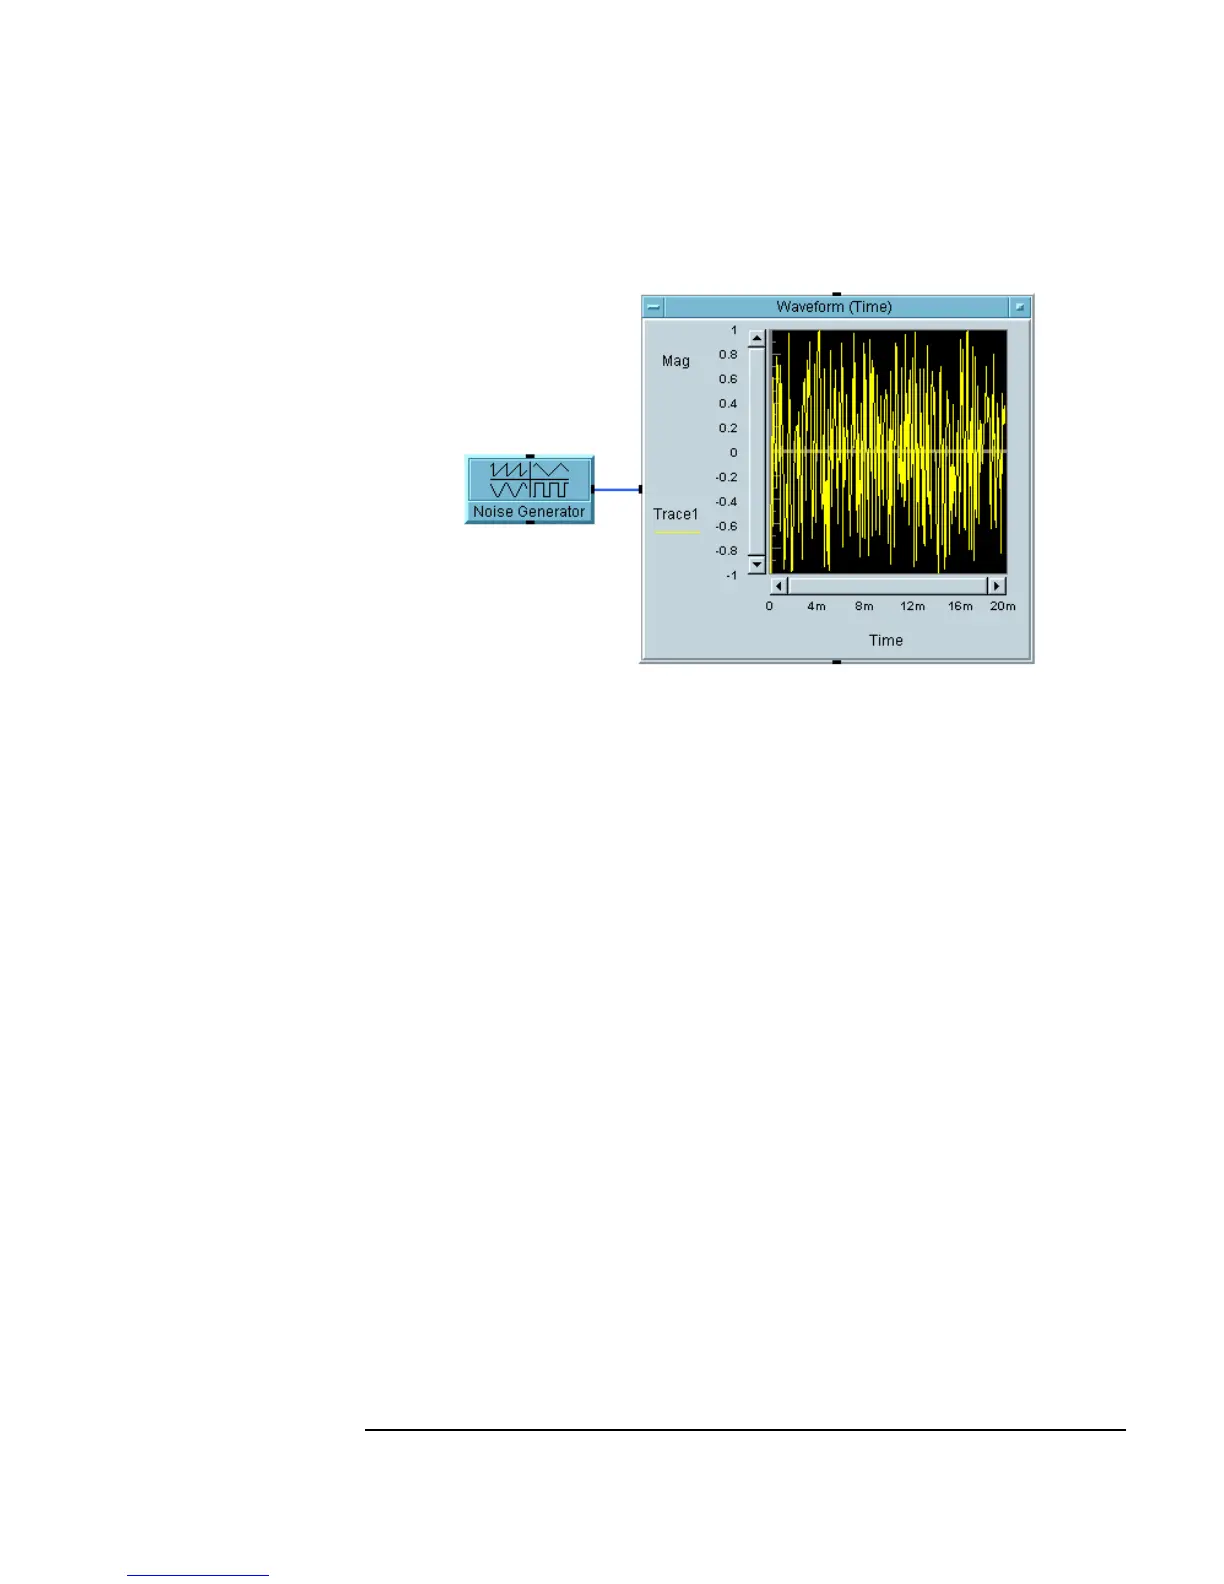
Figure 4-14. Displaying a Waveform
Changing the X and Y Scales
1. Double-click the Waveform (Time) title bar to get the Y Plot
Properties
box, select the Scales folder, select 20m for the X
Maximum and enter 1m.
This alters the time span of the display from 20 milliseconds to 1
millisecond.
2. Double-click the
Minimum field on the Y axis where it says -1, and enter
- .5. Click OK.
Zooming in on Part of the Waveform
1. Open the Waveform (Time) object menu and click Zoom ⇒ In.
The cursor becomes a small right angle. By clicking and dragging, you
can draw a square on the graph outlining the area you want to enlarge.
2. Outline an area of the waveform including several peaks, and release the
mouse button.