Chapter 6 269
Creating Reports Easily Using ActiveX
Using MS Word for Agilent VEE Reports
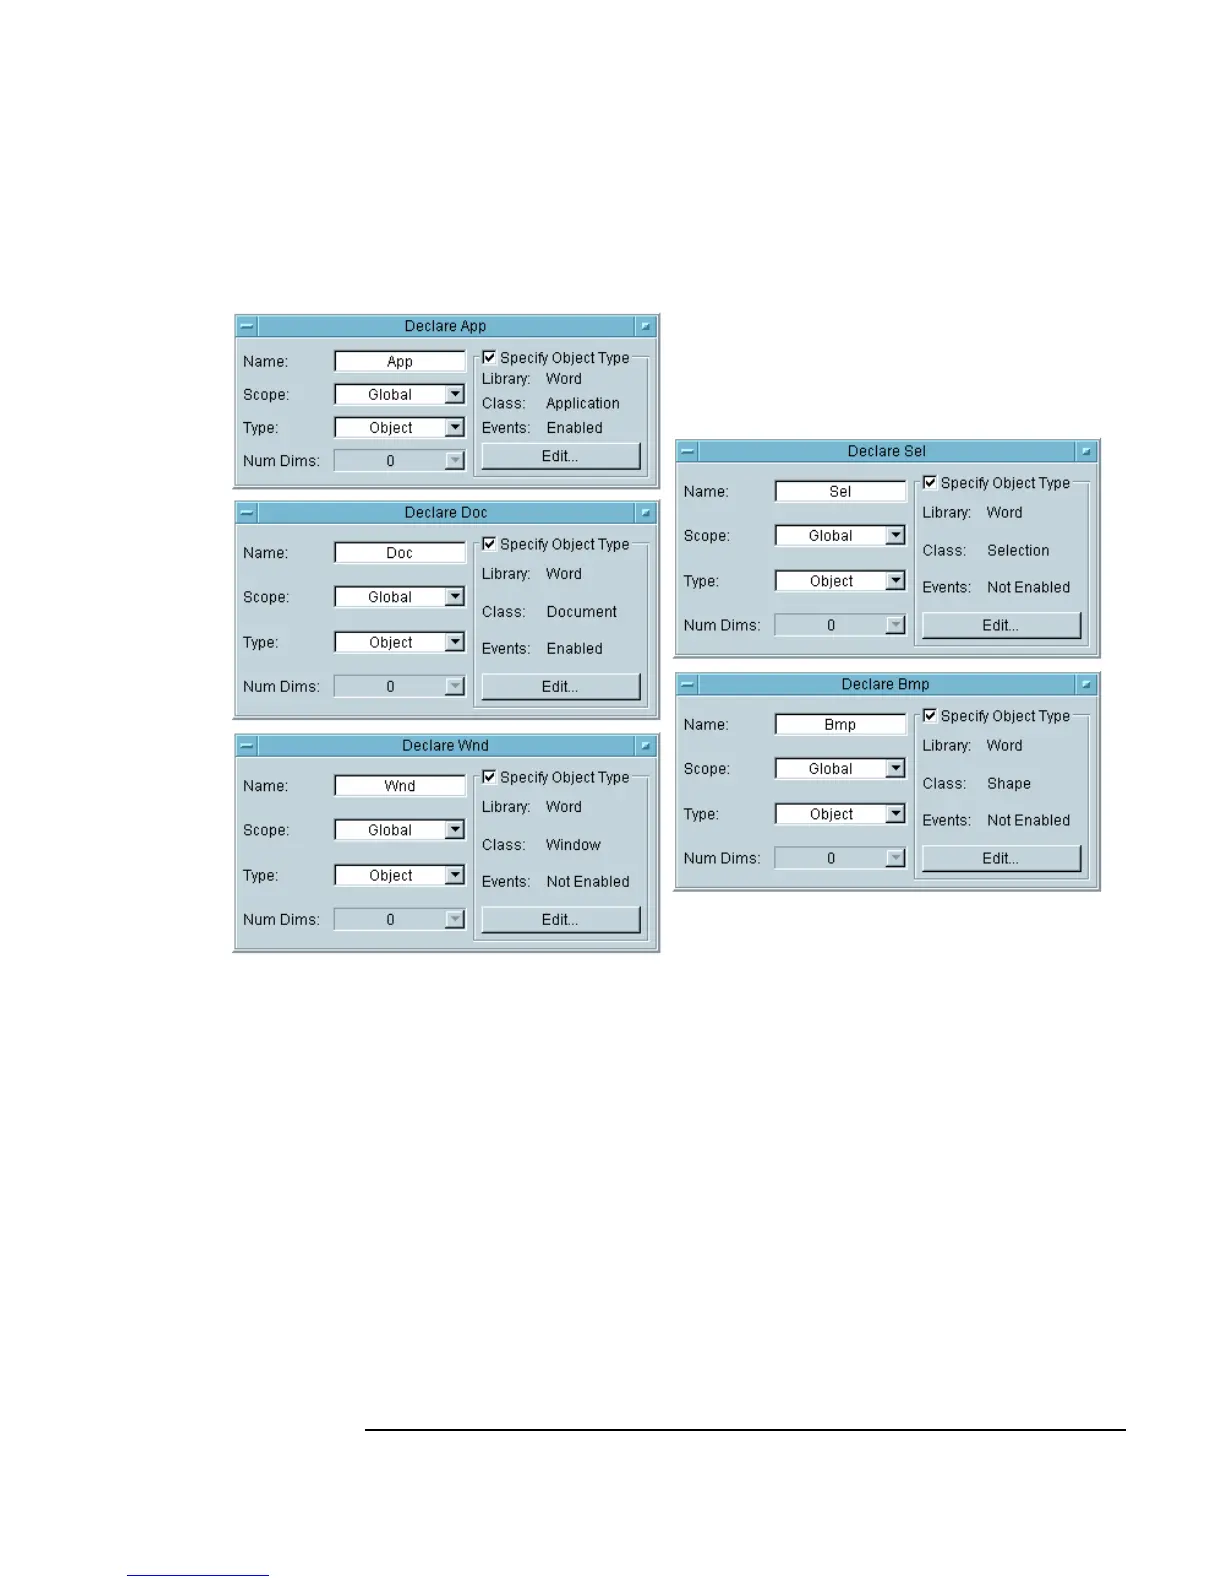
Figure 6-14. Object Variables
3. Create a UserFunction called Graph, which uses a Function
Generator
virtual source to send a sine wave to a Waveform (Time)
display. Create a panel view of the display only. Then generate a
Call
Graph
object in the Main window. (Recall that the UserFunction
object menu includes an easy way to generate a call.)
Now create a bitmap file of the Panel with the Waveform display to use in
the report in MS Word.
4. To create a file name for the bitmap, click
Device ⇒ Formula.
Rename it
Image Filename. Enter installDir() +