CCW-R-2**B INSTRUCTION MANUAL 6 FUNCTIONS OF THE OPERATION SCREENS
6-89
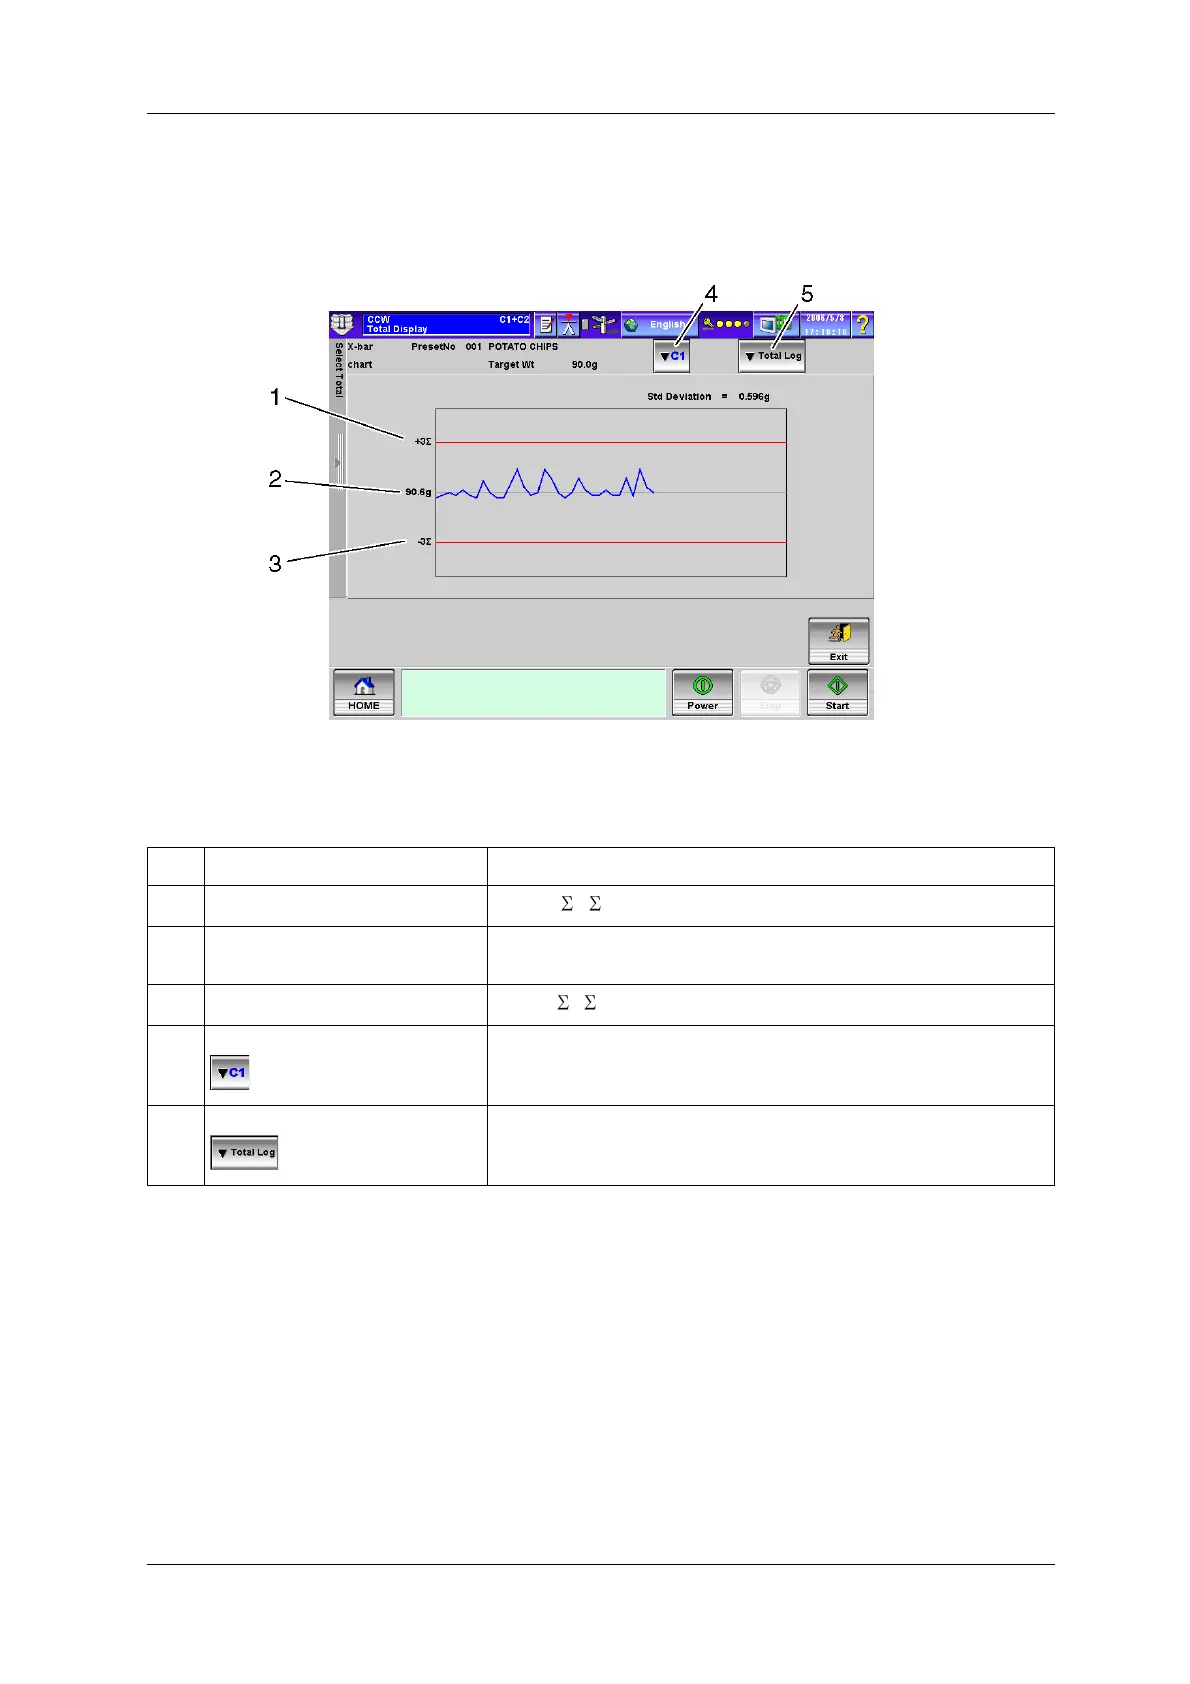
6.12.2 [X-bar Chart] Screen
The [X-bar Chart] screen displays how weighing result averages change using an X-bar chart.
Fig.6-87 [X-bar Chart] Screen ([Total Display] Screen)
Table 6-40 Items and Functions of [X-bar Chart] Screen
No. Name Function
1 Upper limit
Set as +3 ( = standard deviation).
2 Mean value Displays the average of the sum of every weighing result from the total start,
per 250 cycles.
3 Lower limit
Set as -3 ( = standard deviation).
4 [C1]/[C2] switching drop-down key Selects the channel for which total data is to be displayed.
5 [Total Log] drop-down key Displayed when a total log exists.
Selects the total log to be displayed.
 Loading...