127
────────────────────────────────────────────────────
8.3 STATUS1 Settings (FFT)
────────────────────────────────────────────────────
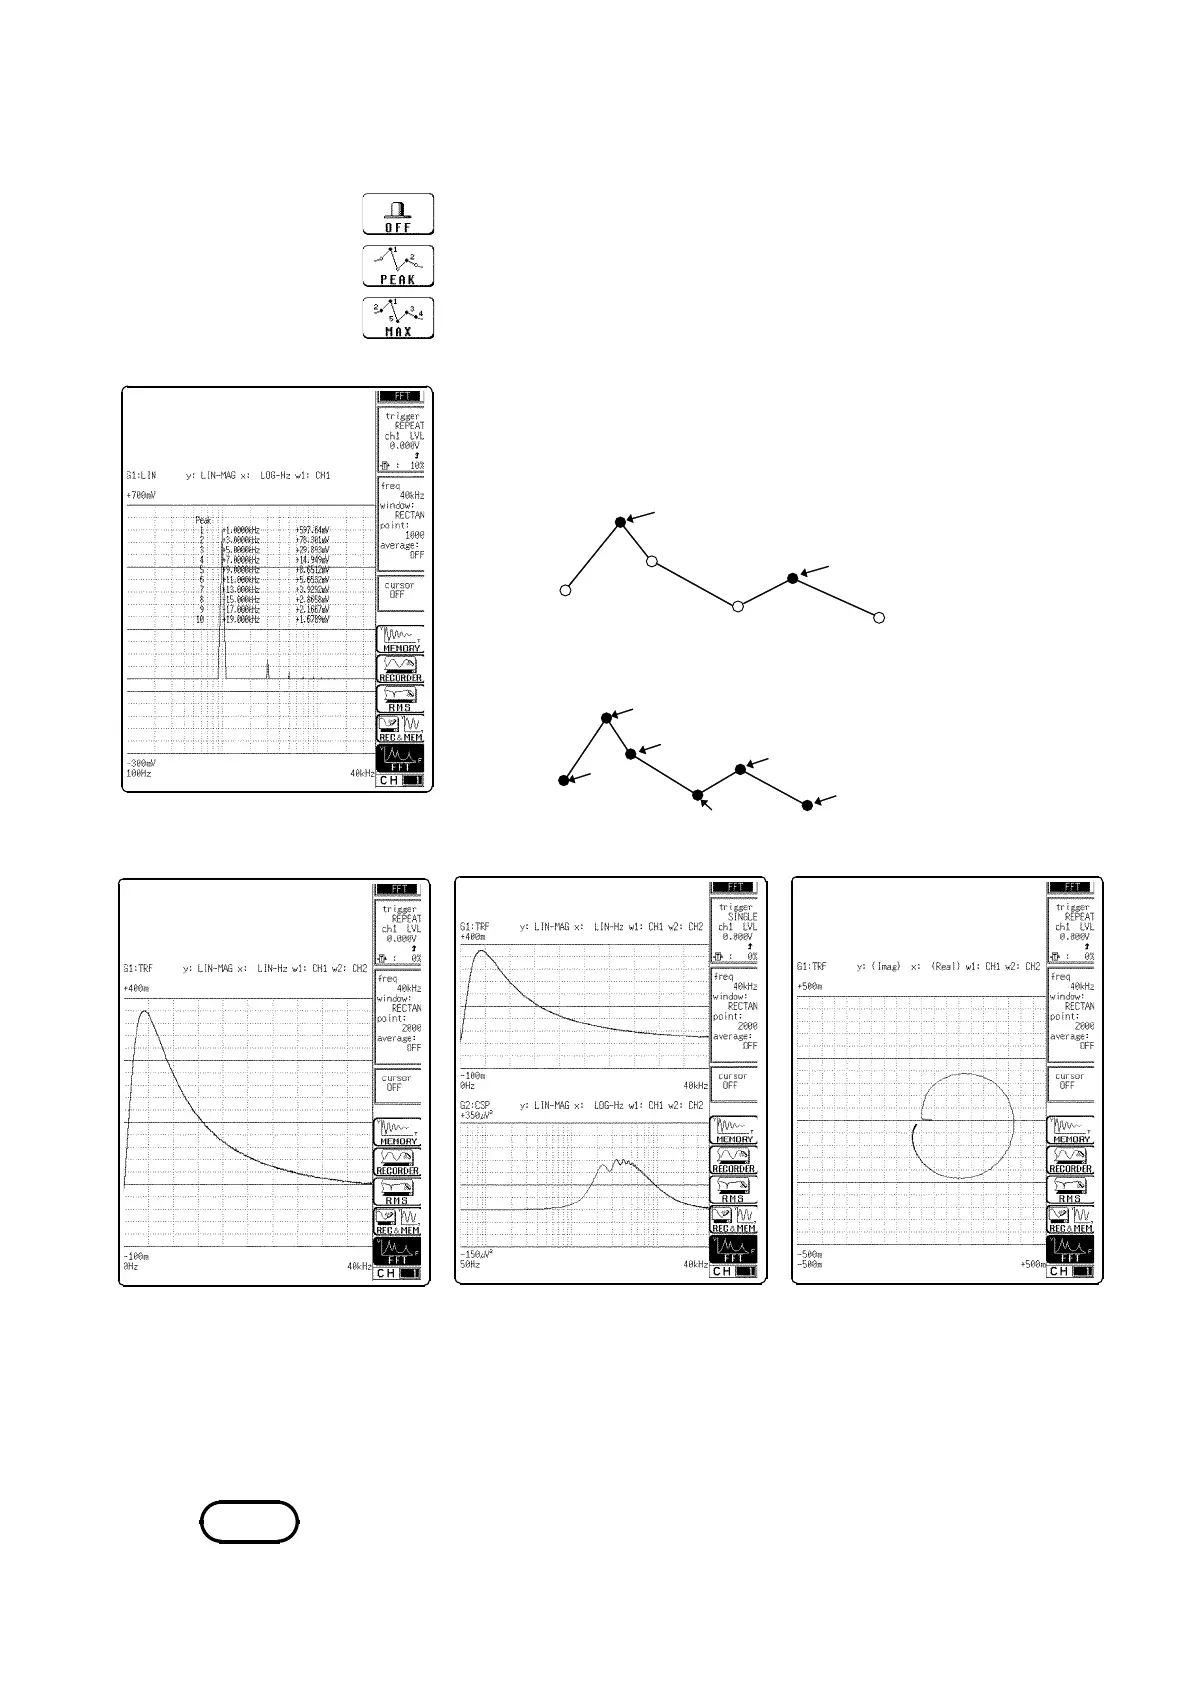
Function
display
Meaning
:
OFF
:
Peak value
:
Maximum value
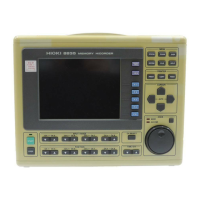
○
,
●・・・
Data
Peak 1
Peak 2
Maximum value
4
2
5
3
6
○
,
●・・・
Data
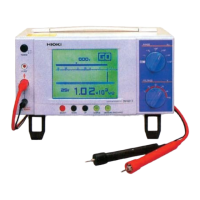
Single graph
Displays the waveform on a
single screen.
Dual graph
Nyquist graph
Divides the waveform display
screen into upper and lower
screens.
For the linear spectrum, cross
power spectrum, and transfer
function, displays the real-number
portion of the data for the FFT
calculation result on the X-axis,
and the imaginary number
portion of the data on the Y-axis.
NOTE
4. When the display format is set to single or dual, the peak item is displayed.
Peak value display
When data at one point are higher than data within the
vicinity, the point is a peak. The 10 highest peaks are
shown.
Maximum value display
Points with the 10 highest values are shown.
The peak value is displayed on the screen and printed out, but it is not
recorded as the peak value in data storage.