150
────────────────────────────────────────────────────
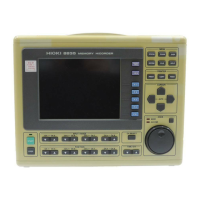
8.7 FFT Analysis Function
────────────────────────────────────────────────────
8.7.4 Power Spectrum [PSP]
Function
Gaa = Fa*
・
Fa
={Re
2
(Fa) + Im
2
(Fa)}
= |Fa|
DC component:
Gaa = Fa*・Fa
={Re
2
(Fa) + Im
2
(Fa)}
=
Fa
2
Fa*
:
complex conjugate of Fa
Re
(
Fa
):
real number component of Fa
Im
(
Fa
):
imaginary number component of Fa
1
2
1
2
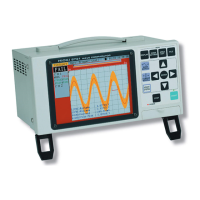
Horizontal
cursor
Vertical
cursor
Displays the energy spectrum of the input signal, consisting of only
magnitude information.
Major applications include:
・Determining the peaks of waveform frequency components
・Determining the energy levels of high and low harmonics
LIN-Hz Frequency spectrum display as linear units. The range is from
DC to the maximum frequency range value.
LOG Hz Frequency spectrum display as logarithmic units. The range is
from between 1/400 and 1/4000 of value to the frequency
range value.
LIN-MAG Linear display of analysis data as binary exponential voltage.
This expresses the energy component.
LOG-MAG Logarithmic display of analysis data as dB
(0dB reference value: 1 V
2
rms)