54
────────────────────────────────────────────────────
4.4 Using the X-Y Waveform Plots (MEM)
────────────────────────────────────────────────────
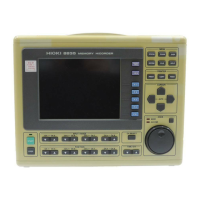
Two single plot is displayed and recorded.
X-Y waveforms of graphs 1 and 3 are
displayed in the upper section, and those
of graphs 2 and 4 are displayed in the
lower section.
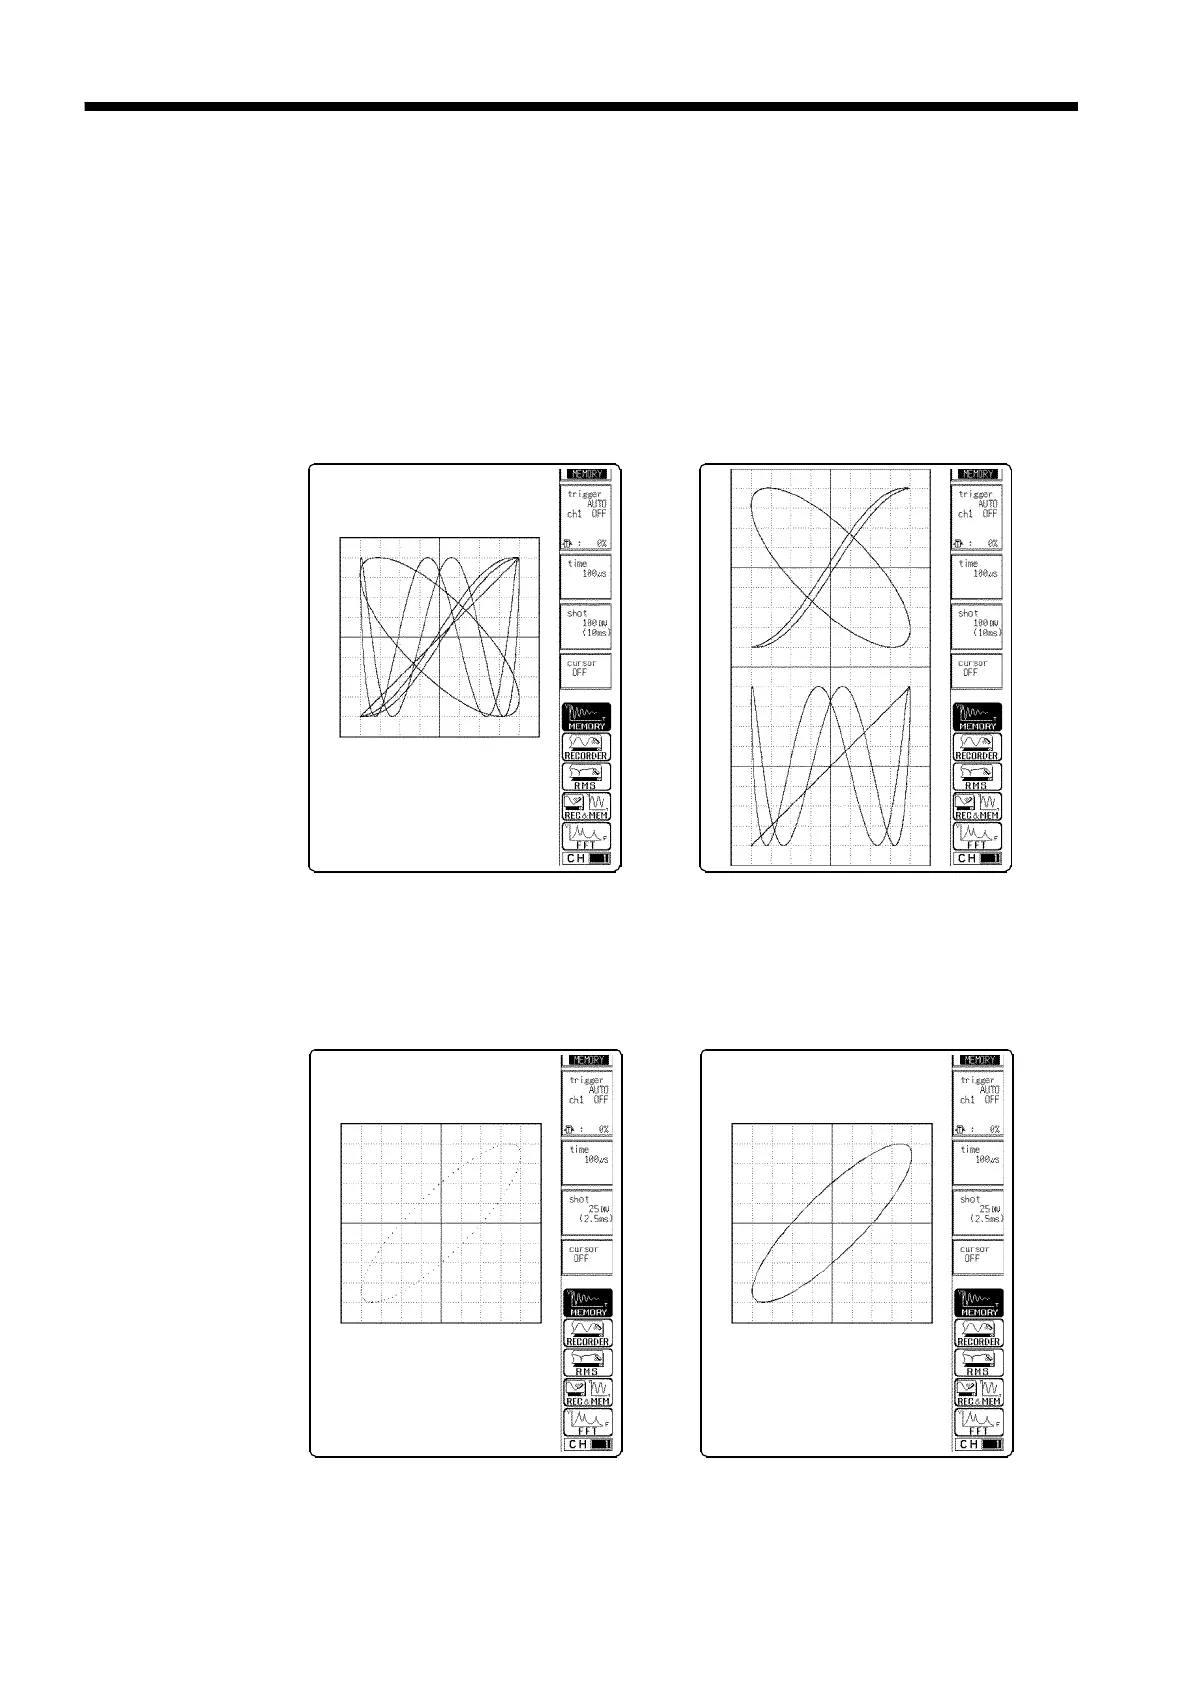
A single plot is displayed and recorded.
X-Y waveforms of graphs 1 to 4 are
displayed in one screen.
・
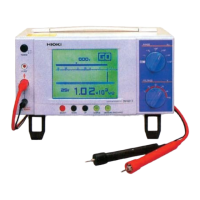
The sampled data is displayed and
recorded just as it comes.
・
Linear interpolation is not performed.
・
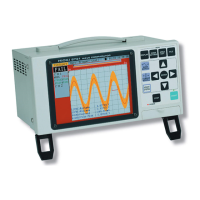
Linear interpolation is performed.
・
The display becomes easier to read, but
display speed is slower compared to dot
display.
X-Y Single
X-Y Dual
X-Y(dot)
X-Y(line)
#s434- 6,
7copy#
s44-1, 2
4.4 Using the X-Y Waveform Plots (MEM)
・Setting the display format to X-Y in status screen allows X-Y waveforms to
be combined. Any of channels 1 to 16 can be selected for each of the X
and Y axis. Up to four X-Y plots can be made simultaneously.
・Voltage axis magnification/compression is active also when using X-Y
combined plotting.
・Using the A・B cursors, it is possible to specify the data between the cursors
for partial plotting.