133
────────────────────────────────────────────────────
8.3 STATUS1 Settings (FFT)
────────────────────────────────────────────────────
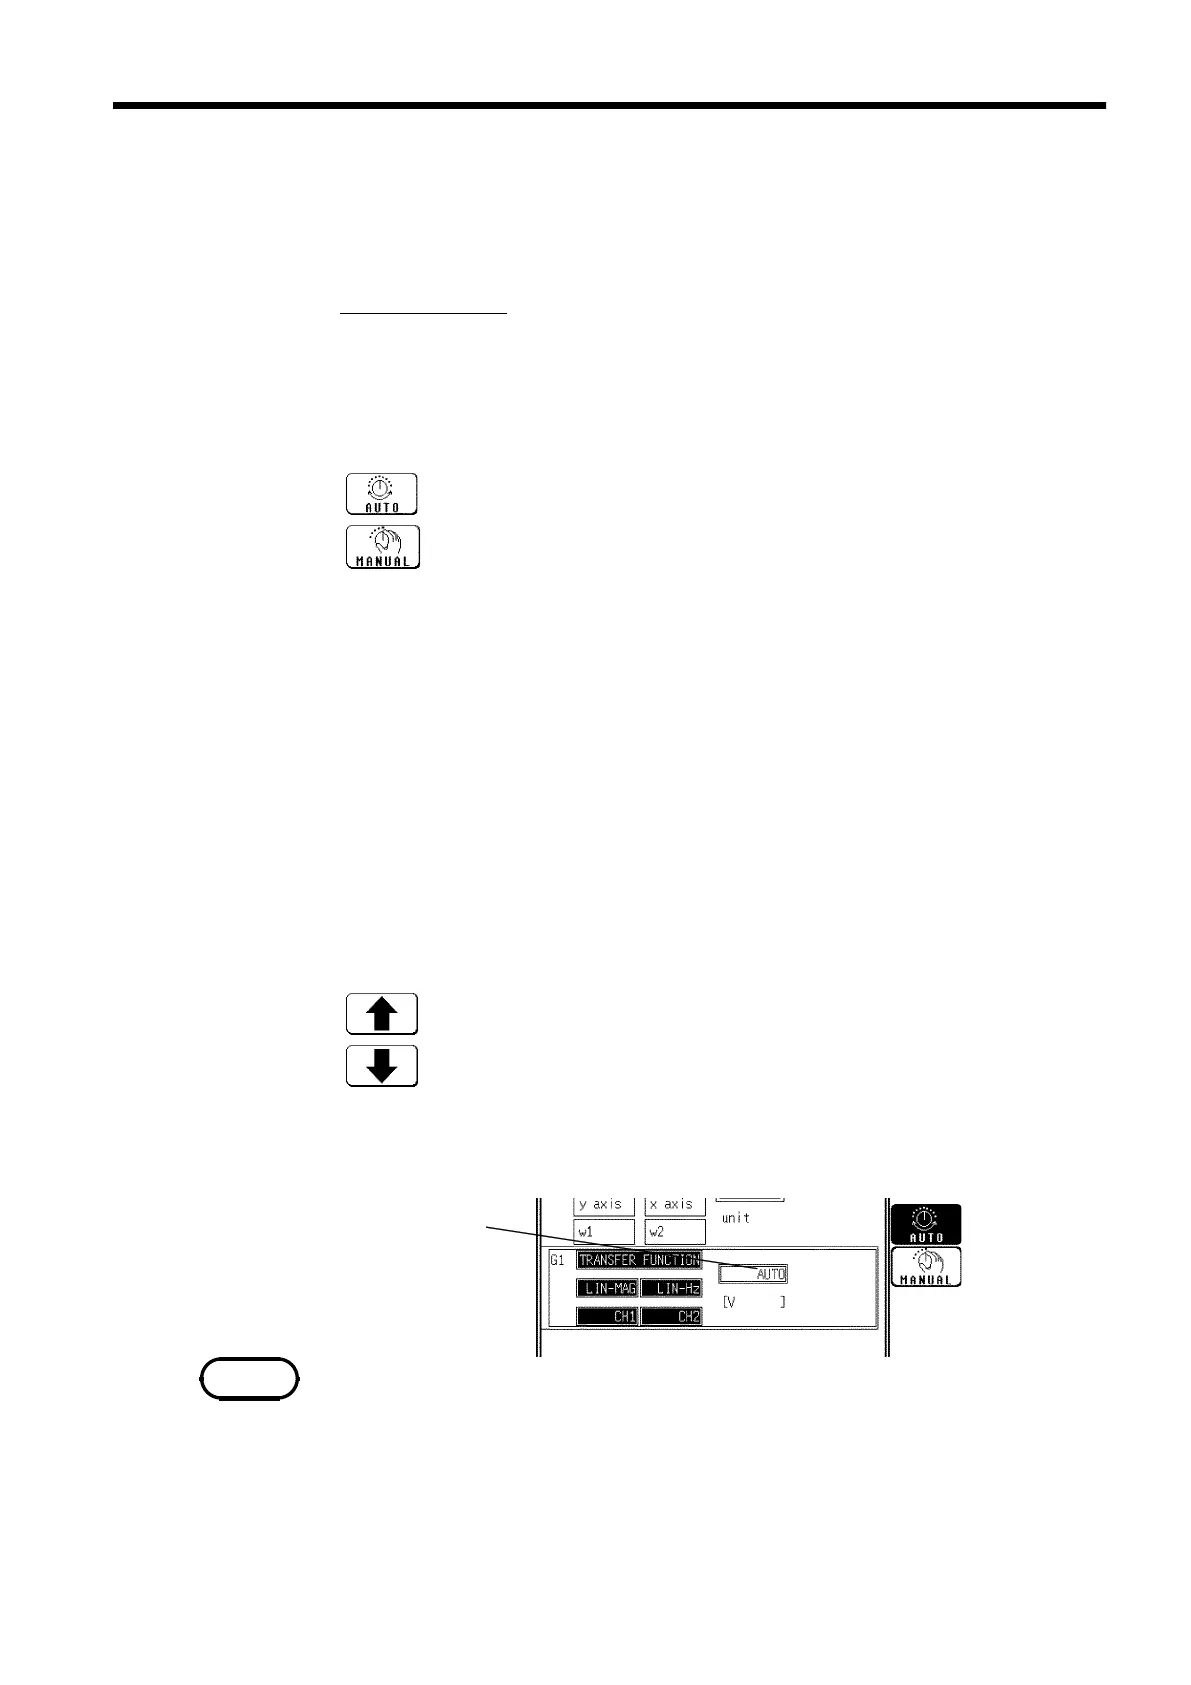
8.3.11 Setting the Display Scale
Function
display Meaning
:
The vertical axis (Y-axis) scale is set automatically, depending on
the processing result.
:
The vertical axis (Y-axis) scale can be set as desired, to match the
purpose of the measurement. This is useful for enlarging or reducing
the amplitude and for shiftin
the waveform up or down.
Function
display Meaning
:
Increases the number.
:
Decreases the number.
Flashing cursor
NOTE
The display scale for showing the FFT processing result can either be set
manually or automatically.
Procedure
Screen: STATUS1
1. Press the STATUS key to display the STATUS1 screen.
2. Move the flashing cursor to the scale
item.
3. Use the function keys to make a setting.
4. When
MANUAL is selected, set the upper and lower limits to display and
record the processing result.
Setting range is -9.9999E+29 to 9.9999E+29. (exponent is E-29 to E+29).
Numerical setting procedure
Procedure 1
1. Using the cursor keys, move the flashing cursor to the item (upper/lower
limit value) to be input.
2. Move the flashing cursor to the digit to be input.
3. Use the function keys or Jog control to enter the numerical value. (To move
the digit, use the function keys or Shuttle control.)
Procedure 2
1. Select the use num.key function key.
2. Enter the numerical value by using the numerical input key.
・ The unit (eu) setting is affected by the scaling setting. When scaling is
turned off, a unit of measurement range is displayed.
・ The selected unit is displayed for those channels for which the scaling
function has been set.
・ The X-axis setting for the histogram can be changed on the Waveform
display screen or the CHANNEL screen. (If the upper or lower limit value is
changed, the x-axis is changed.)