130
────────────────────────────────────────────────────
8.3 STATUS1 Settings (FFT)
────────────────────────────────────────────────────
8.3.9 Setting the X-axis and Y-axis Displays
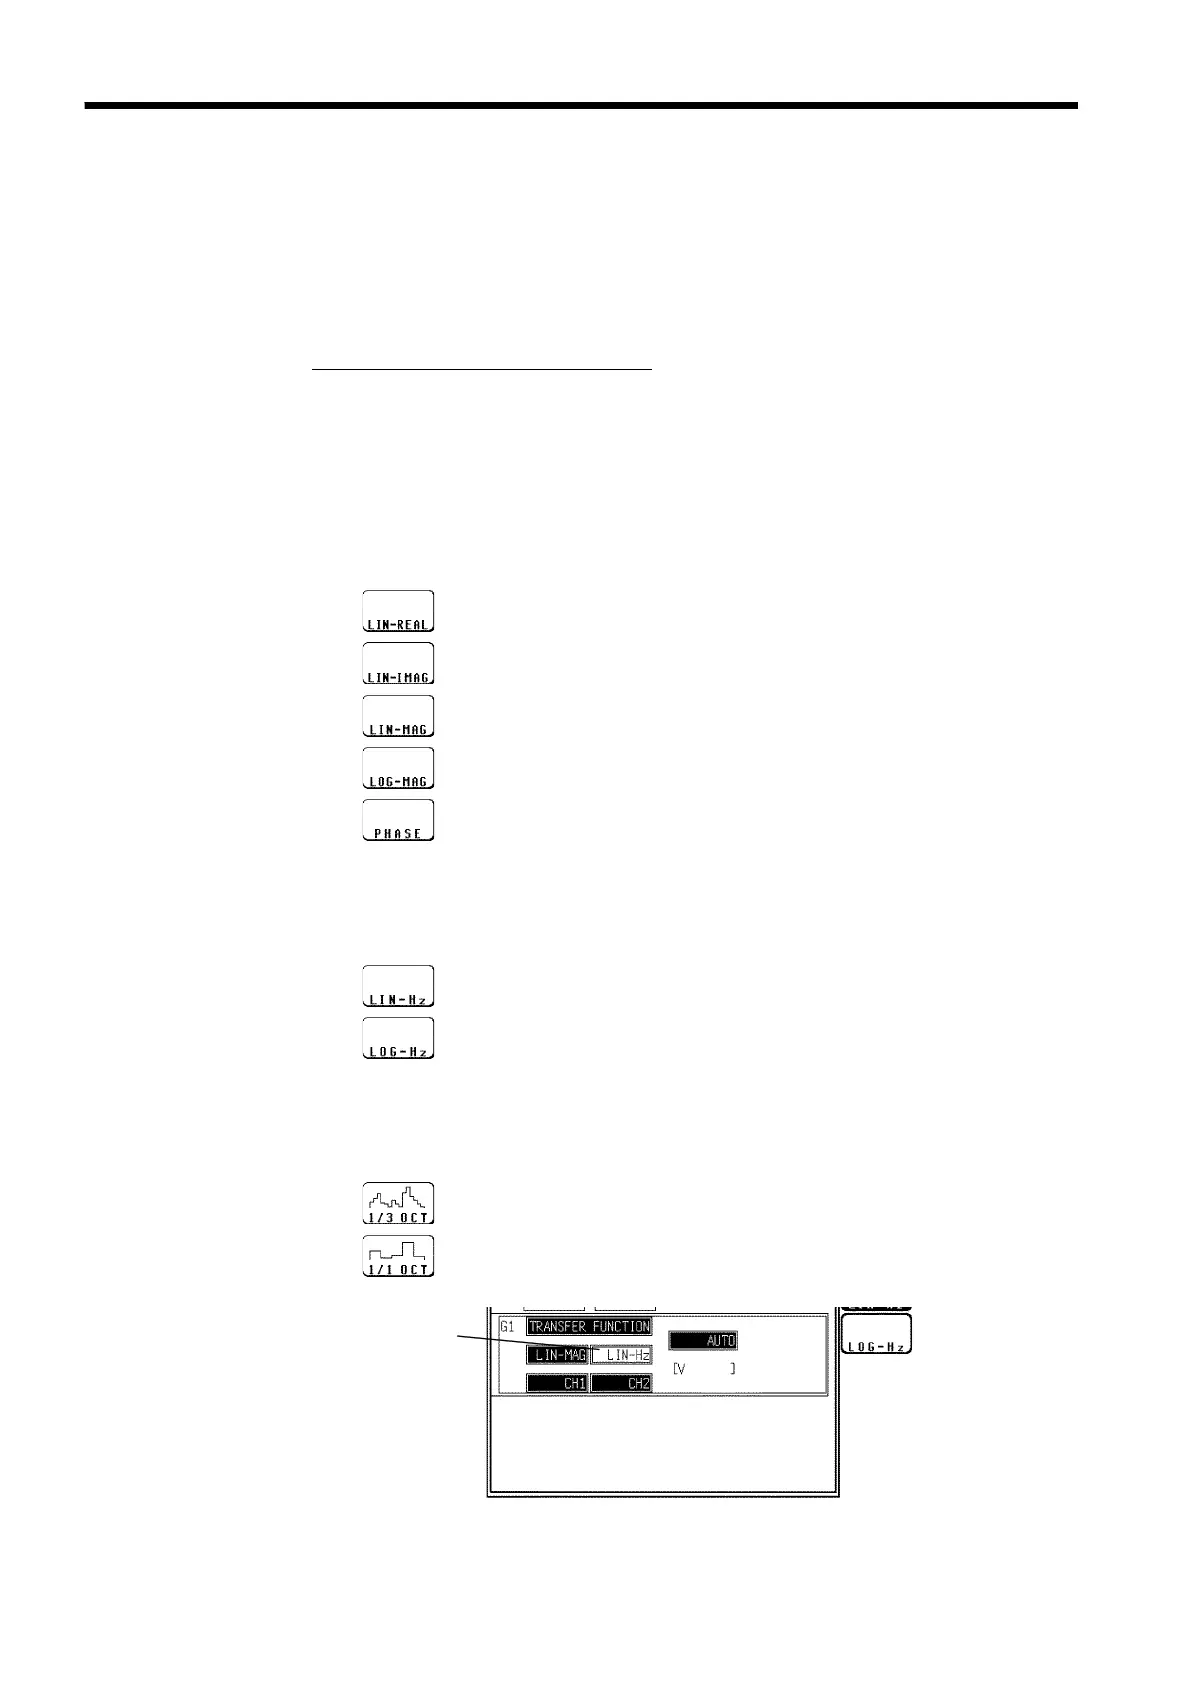
Function
display
Meaning
:
Real number part (linear display)
:
Imaginary number part (linear display)
:
Amplitude (linear display)
:
Amplitude (decibel display)
:
Phase (degree display)
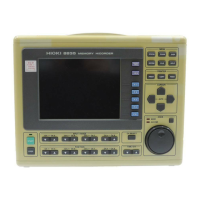
Function
display
Meaning
:
Frequency (linear display)
:
Frequency (logarithm display)
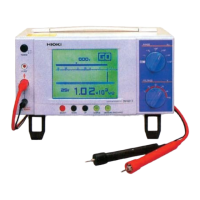
Function
display
Meaning
:
1/3 octave
:
1/1 octave
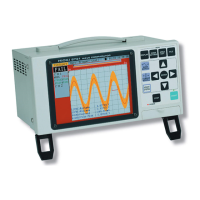
Flashing cursor
Set the X and Y axis for display of FFT calculation results. Different units
can be selected for the X and Y axis. With some FFT analysis modes, one of
the axis cannot be set.
When external sampling is used, the X-axis (horizontal axis) expresses the
data count.
Procedure
Screen: STATUS1, Waveform display
1. Use the Menu keys to display the desired screen.
2. Move the flashing cursor to the y-axis item.
3. Use the function keys or Jog control, select the channel. Set the x-axis in the
same way.
Y-axis
X-axis
(When octave analysis)