55
────────────────────────────────────────────────────
4.4 Using the X-Y Waveform Plots (MEM)
────────────────────────────────────────────────────
s44-3
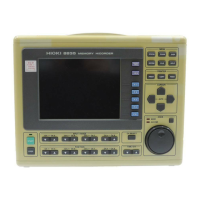
Function
display
Meaning
:
Move the cursor up in the selection window.
:
Move the cursor down in the selection window.
:
Waveform is performed.
:
Waveform is not performed.
Procedure
Screen: STATUS1
1. Press the
STATUS
key to display the STATUS1 screen.
2. Move the flashing cursor to the format item.
3. Use the function keys to select the
X-Y single or X-Y dual format.
4. Set the interpolation. (See Section 4.3.5)
5. Press the
CHAN
key to display the CHANNEL screen.
6. Press the
CH.SET
key to display page 3/3.
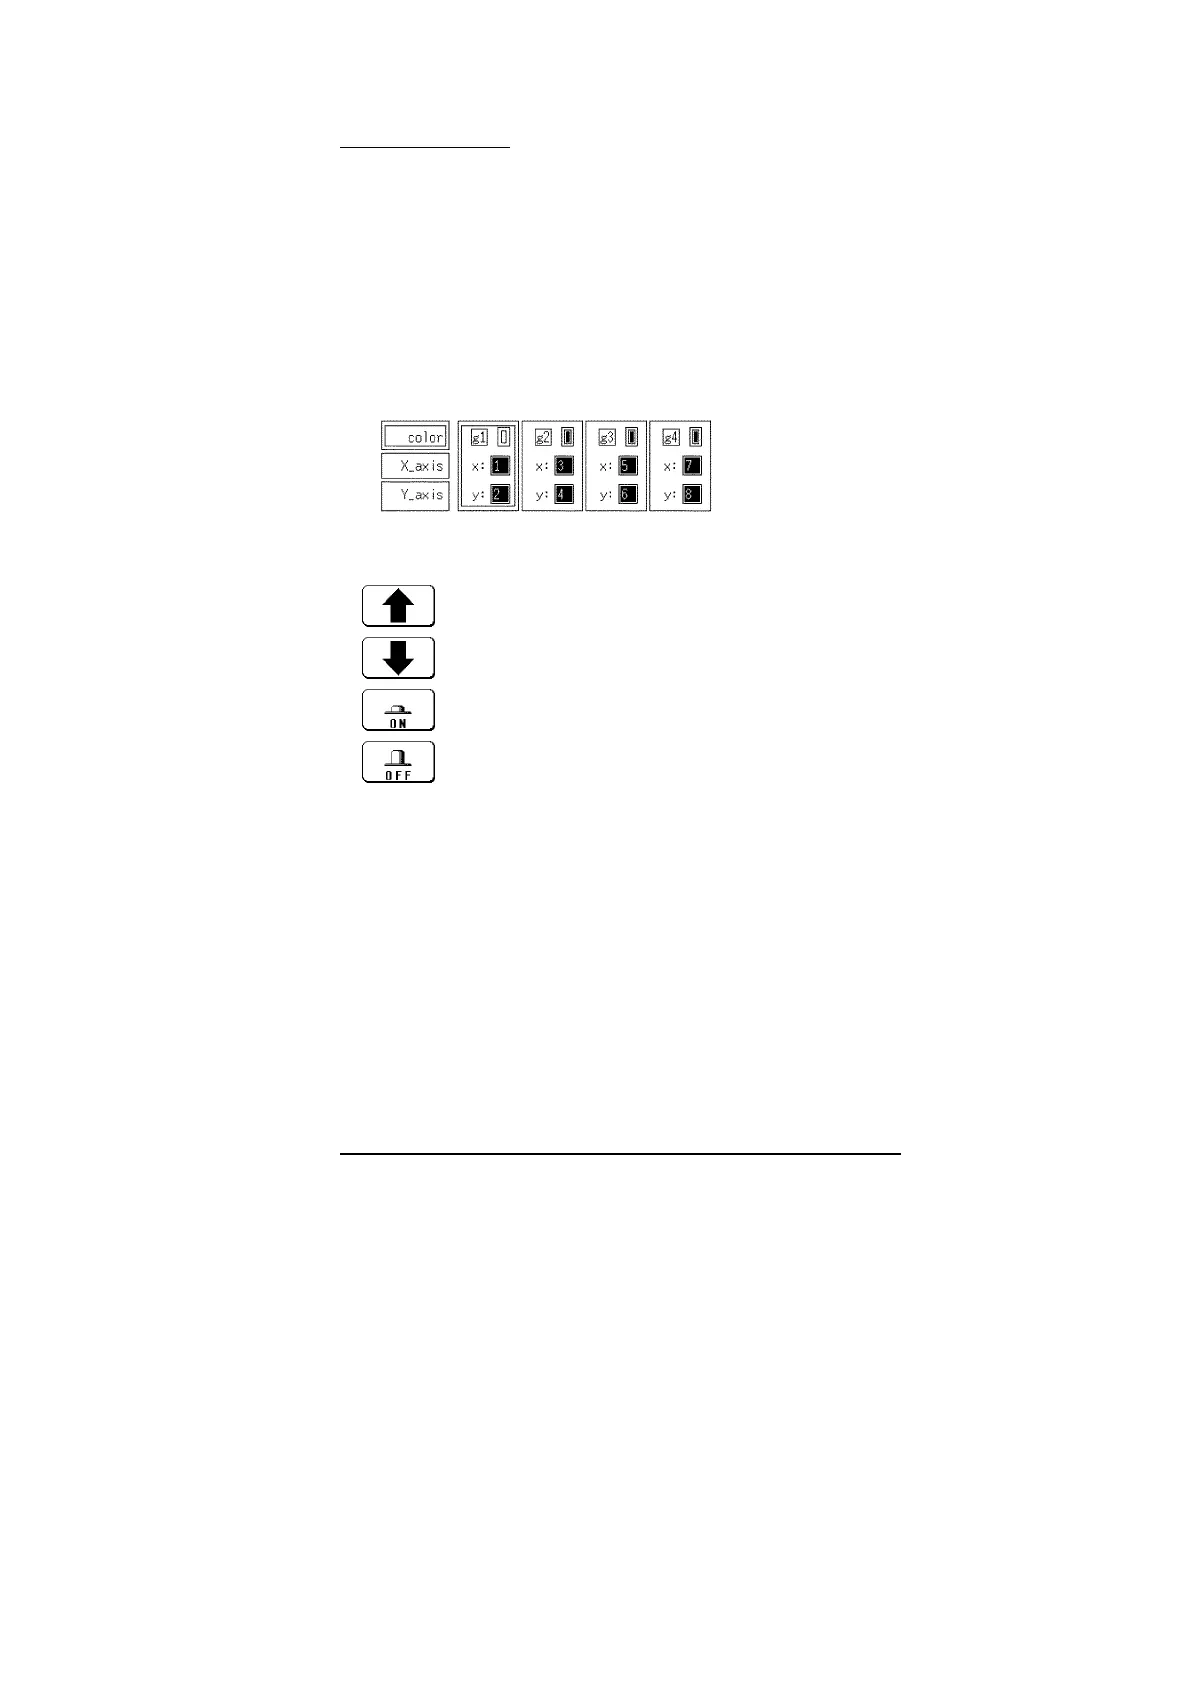
7. Move the flashing cursor to desired channel, and use the function keys to set
the waveform color (including displays waveform ON/OFF).
8. Specify the X-axis channel.
Move the cursor to the channel to be used as X axis. And use the function
keys or the Jog/Shuttle control to select X axis.
9. Specify the Y-axis channel.
This is done in the same way as the X-axis setting.
10. For graph 2 to graph 4, the settings are made in an identical.
Partial X-Y plot
Using the A・B cursors, it is possible to specify a range for partial X-Y
plotting. (Normal X-Y plotting covers all data of the recording length.)
Procedure
Screen: Waveform display (excluding X-Ysingle and X-Ydual)
1. Display the captured waveform data, using a format other than X-Ysingle
and X-Ydual.
2. Use the A・B cursors to specify the desired portion for plotting (see Section
11.2).
3. Press the STATUS
key to display the STATUS1 screen.
4. Carry out combined plotting as described above.
In partial X-Y plot, the screen displays the period of time passed after the
completion of the trigger specified using the cursors A and B.