3: Instrument description 2470 High Voltage SourceMeter Instrument
3-30 2470-901-01 Rev. A / May 2019
Views Histogram menu
The Histogram menu allows you to graph the distribution of measurement data in the
selected reading buffer. It also contains tabs that you use to customize the histogram.
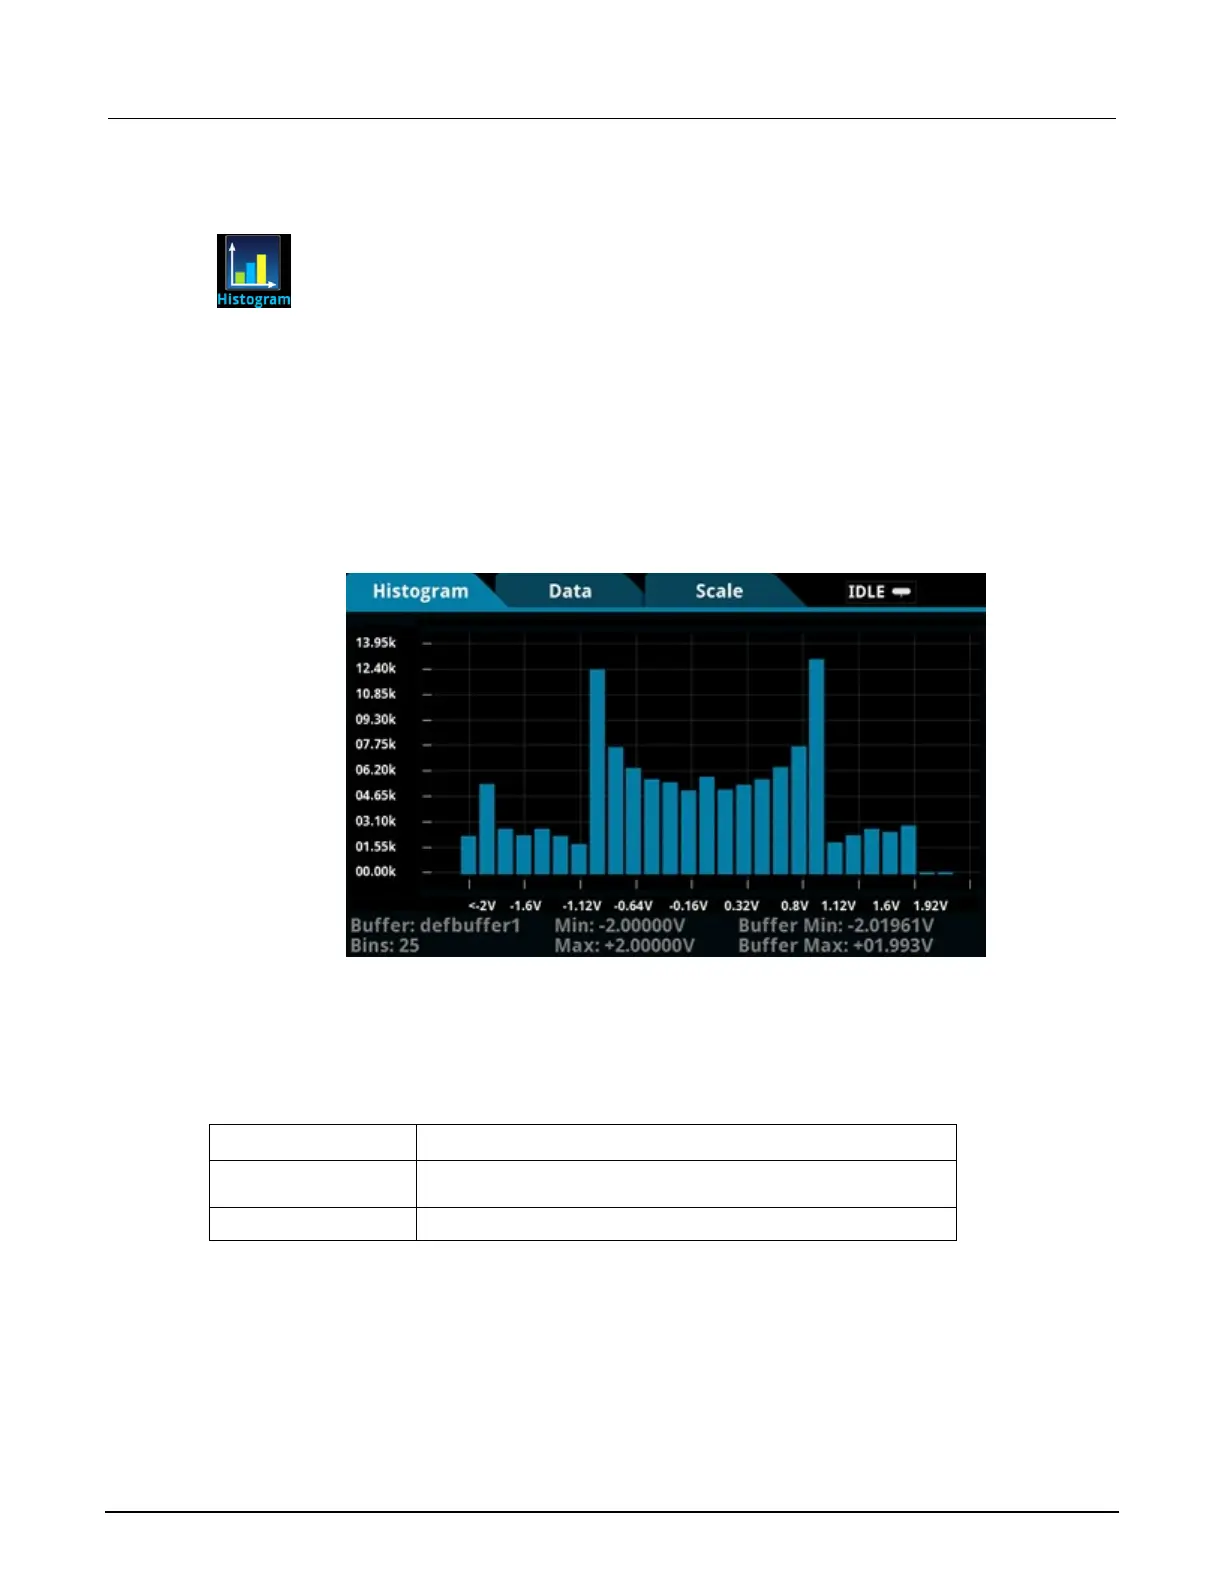
Histogram tab
The Histogram tab graphs readings as a bar graph of the data distribution into bins. Settings you
make on the Data and Scale tabs affect which data are used and how data distributions appear on
this screen. You can change the scale of either axis on the screen by dragging or pinching the
screen.
Figure 48: 2470 Histogram
Data tab
The Data tab allows you to select which reading buffer provides the data that is binned on the
Histogram tab. You can also clear the data from the selected buffer.
Setting Description
Add Trace
Selects the reading buffers that supply the data for the traces on
the Data tab.
Clear Buffer
Clears data from the selected buffer.
 Loading...