CHAPTER58 Syslog and Debug Recording
Mediant 1000 Gateway & E-SBC | User's Manual
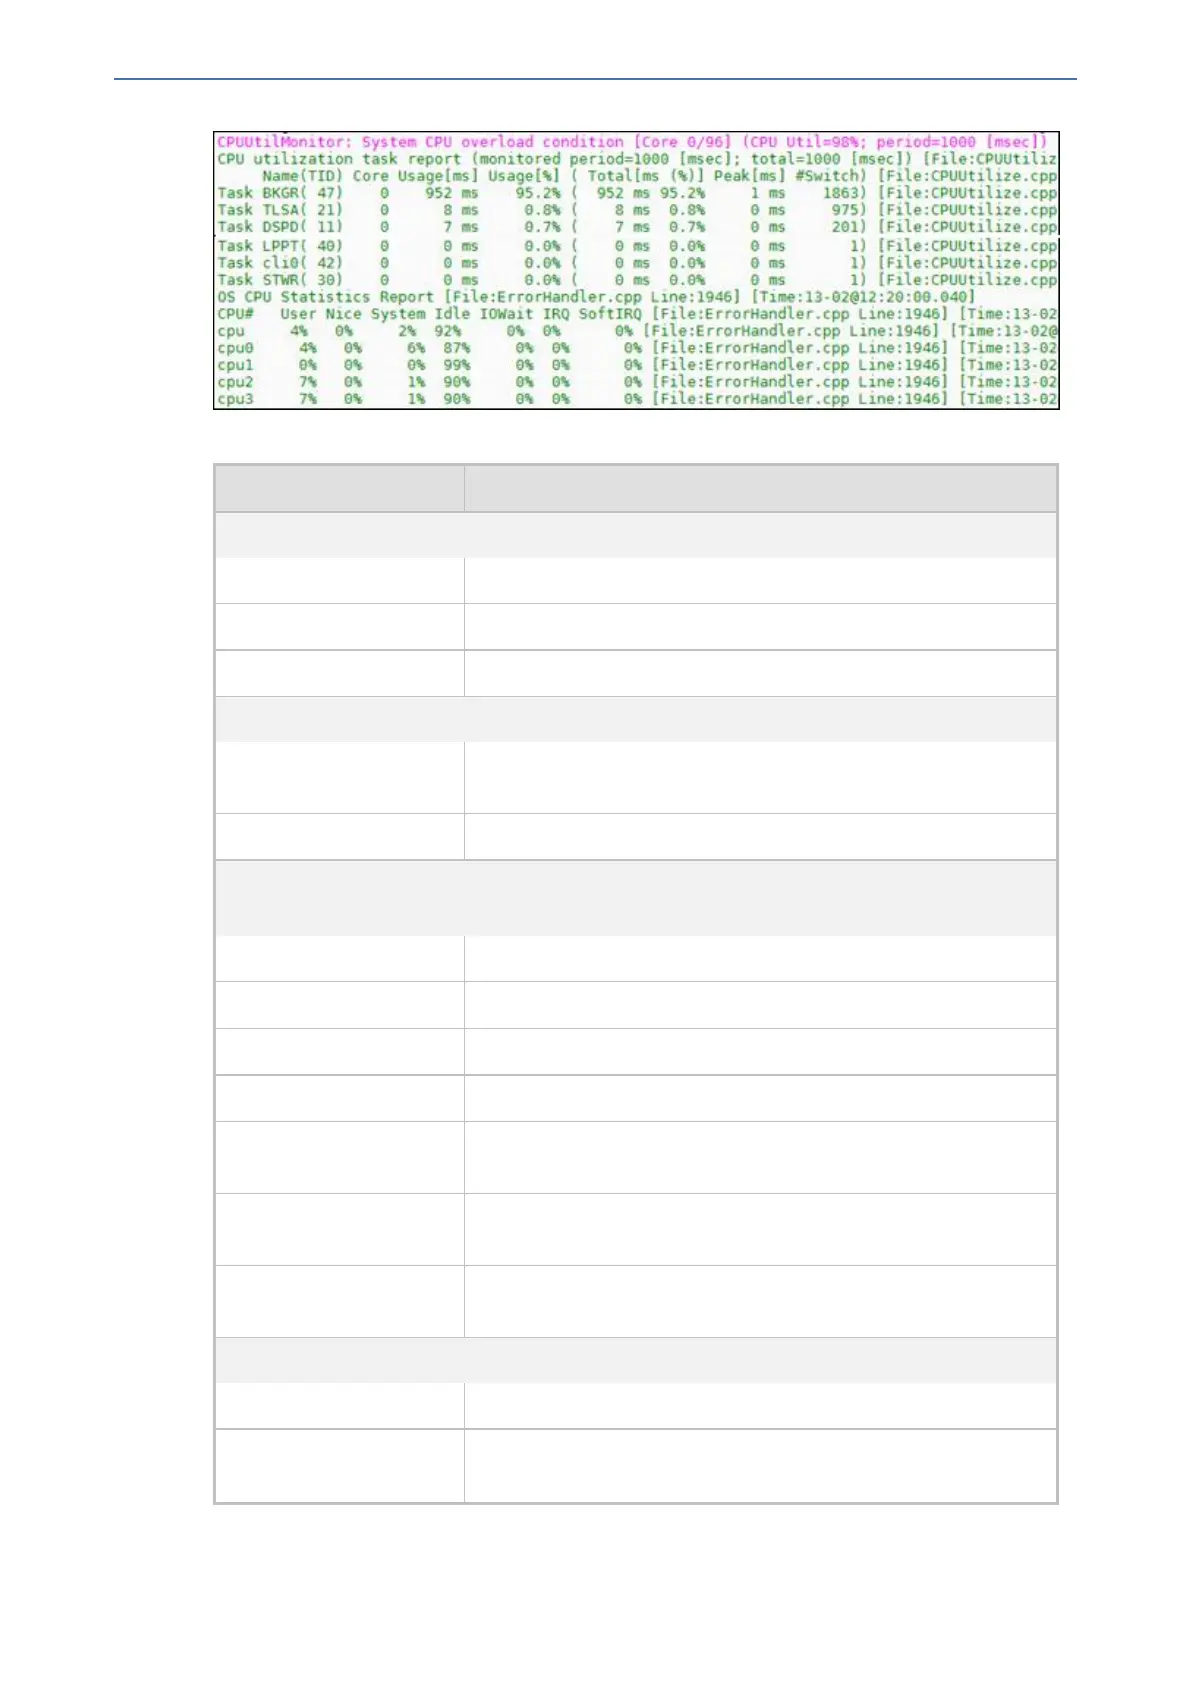
Table 58-7: CPU Overload Fields Description in Syslog Message
Field Description
First line (shown in pink)
“Core” Index of the CPU core.
“CPU Util” CPU utilization (in percentage).
“period” Total period (in msec).
Second line
“monitored period” Duration (in msec) of CPU overload within the total monitored
period.
“total“ Monitored period (in msec).
Statistics per task (process) in overloaded cores only
Note: By default, the Syslog message only shows the five most used tasks in the last period.
“Name (TID)” Name of task (process).
“Core” Index of the CPU core.
“Usage [ms]” Total time (msec) of monitored period that the task utilized CPU.
“Usage [%]” Percentage of time of monitored period that the task utilized CPU.
“Total [ms (%)]” Total time (in msec) and percentage that task utilized CPU during
entire period.
“peak [ms]” Maximum lasting time (msec) that the task utilized CPU during
the period.
“#Switch” Context switch time - number of consecutive periods that were
allocated for this task.
Statistics per CPU core
"CPU#" Index of the CPU core.
"User" Percentage of CPU utilization that occurred while executing at the
user level (application).
- 1052 -