CHAPTER53 Viewing Performance Monitoring
Mediant 1000 Gateway & E-SBC | User's Manual
Use the Zoom In button to increase the displayed time resolution or the Zoom Out
button to decrease it. Instead of using these buttons, you can use the slide ruler. As you increase
the resolution, more data is displayed on the graph. The minimum resolution is about 30 seconds;
the maximum resolution is about an hour.
To pause the graph, click the Pause button; click Play to resume.
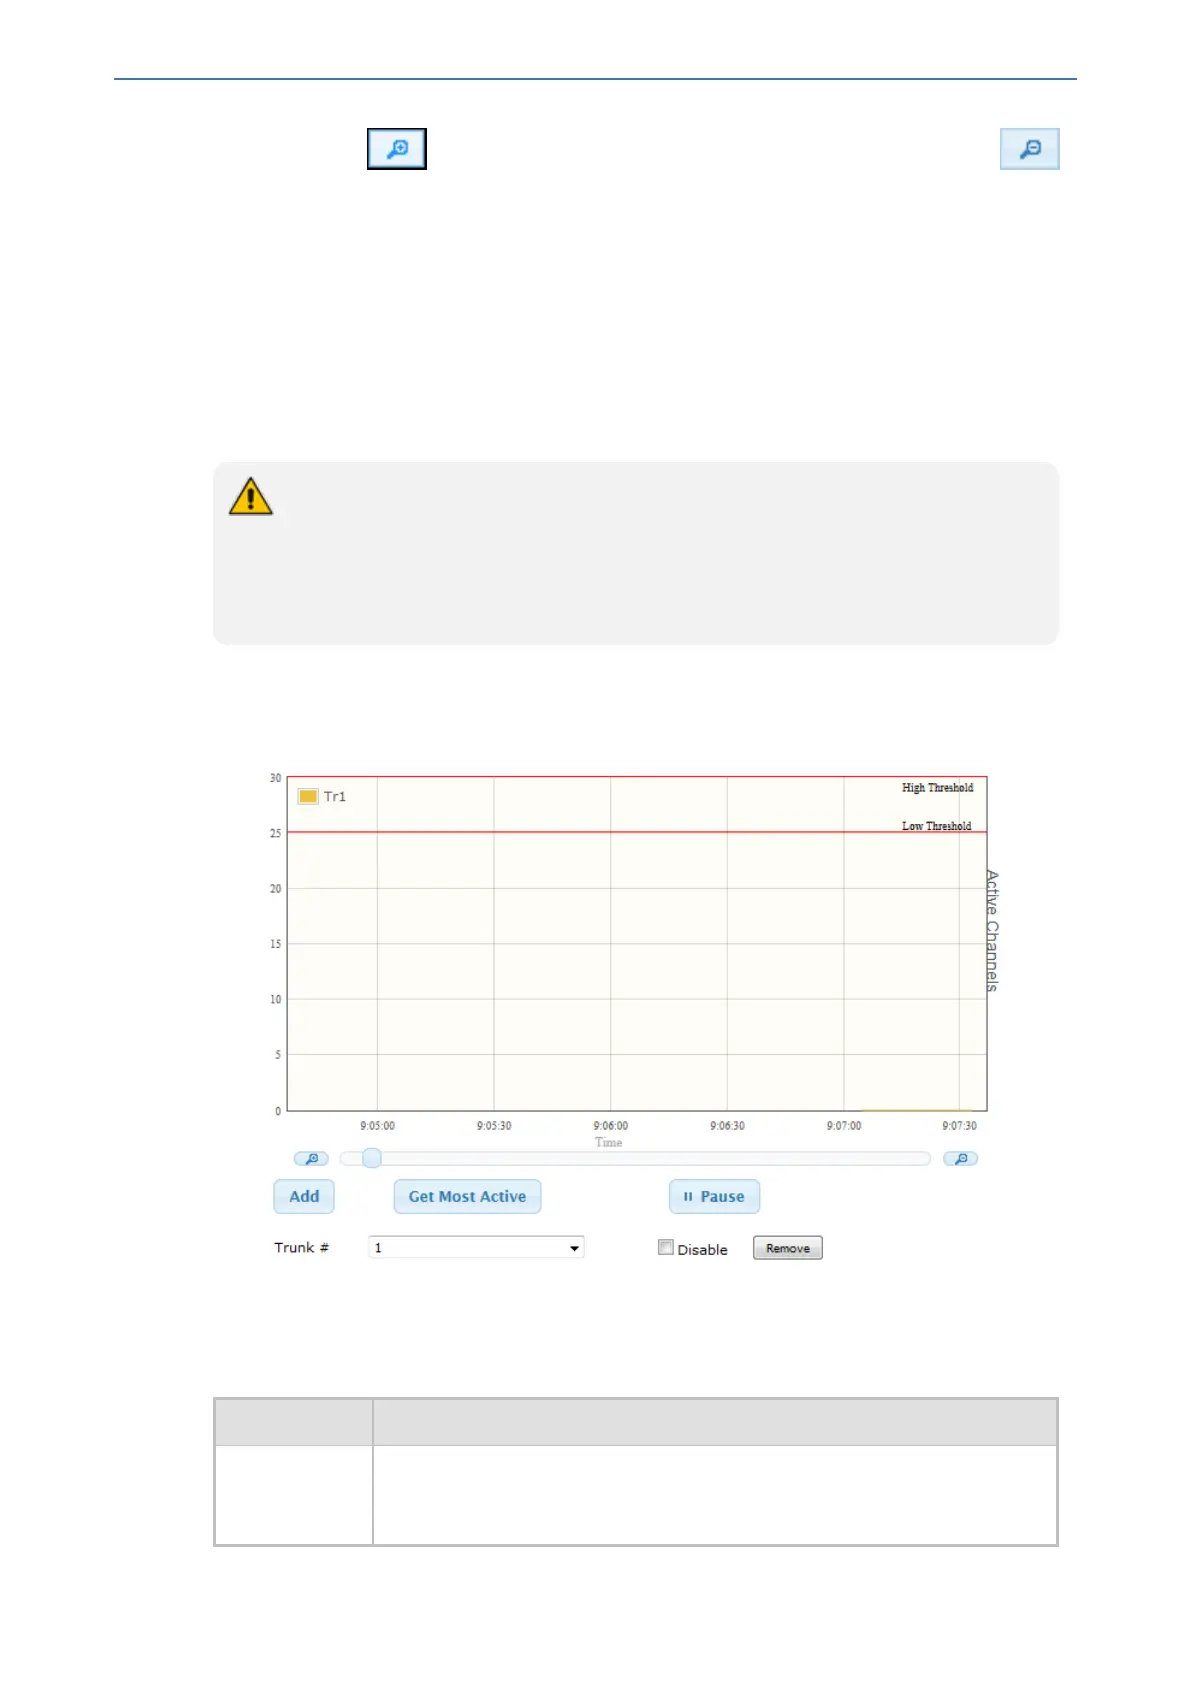
Viewing Trunk Utilization
You can view the number of active channels per trunk over time in the Web interface's Trunk
Utilization page. The page displays a graph, where the x-axis indicates the time (hh:mm:ss) and the
y-axis the number of active trunk channels.
● The Trunk Utilization page is applicable only to the Gateway application.
● To view the graph, your device must be connected to and configured with trunks.
● To view the graph, you must first disable the SBC application.
● If you navigate to a different page, the data displayed on the graph and all its
settings are cleared.
➢ To view the number of active trunk channels:
1. Open the Trunk Utilization page (Monitor menu > Monitor tab > Performance Monitoring
folder > Trunk Utilization).
2. From the 'Trunk' drop-down list, select the trunk for which you want to view active channels.
3. For more graph functionality, see the following table:
Table 53-1: Additional Graph Functionality for Trunk Utilization
Button Description
Add button Displays additional trunks in the graph. Up to five trunks can be displayed
simultaneously. To view another trunk, click the button and then from the
new 'Trunk' drop-down list, select the required trunk.
- 939 -