CHAPTER53 Viewing Performance Monitoring
Mediant 1000 Gateway & E-SBC | User's Manual
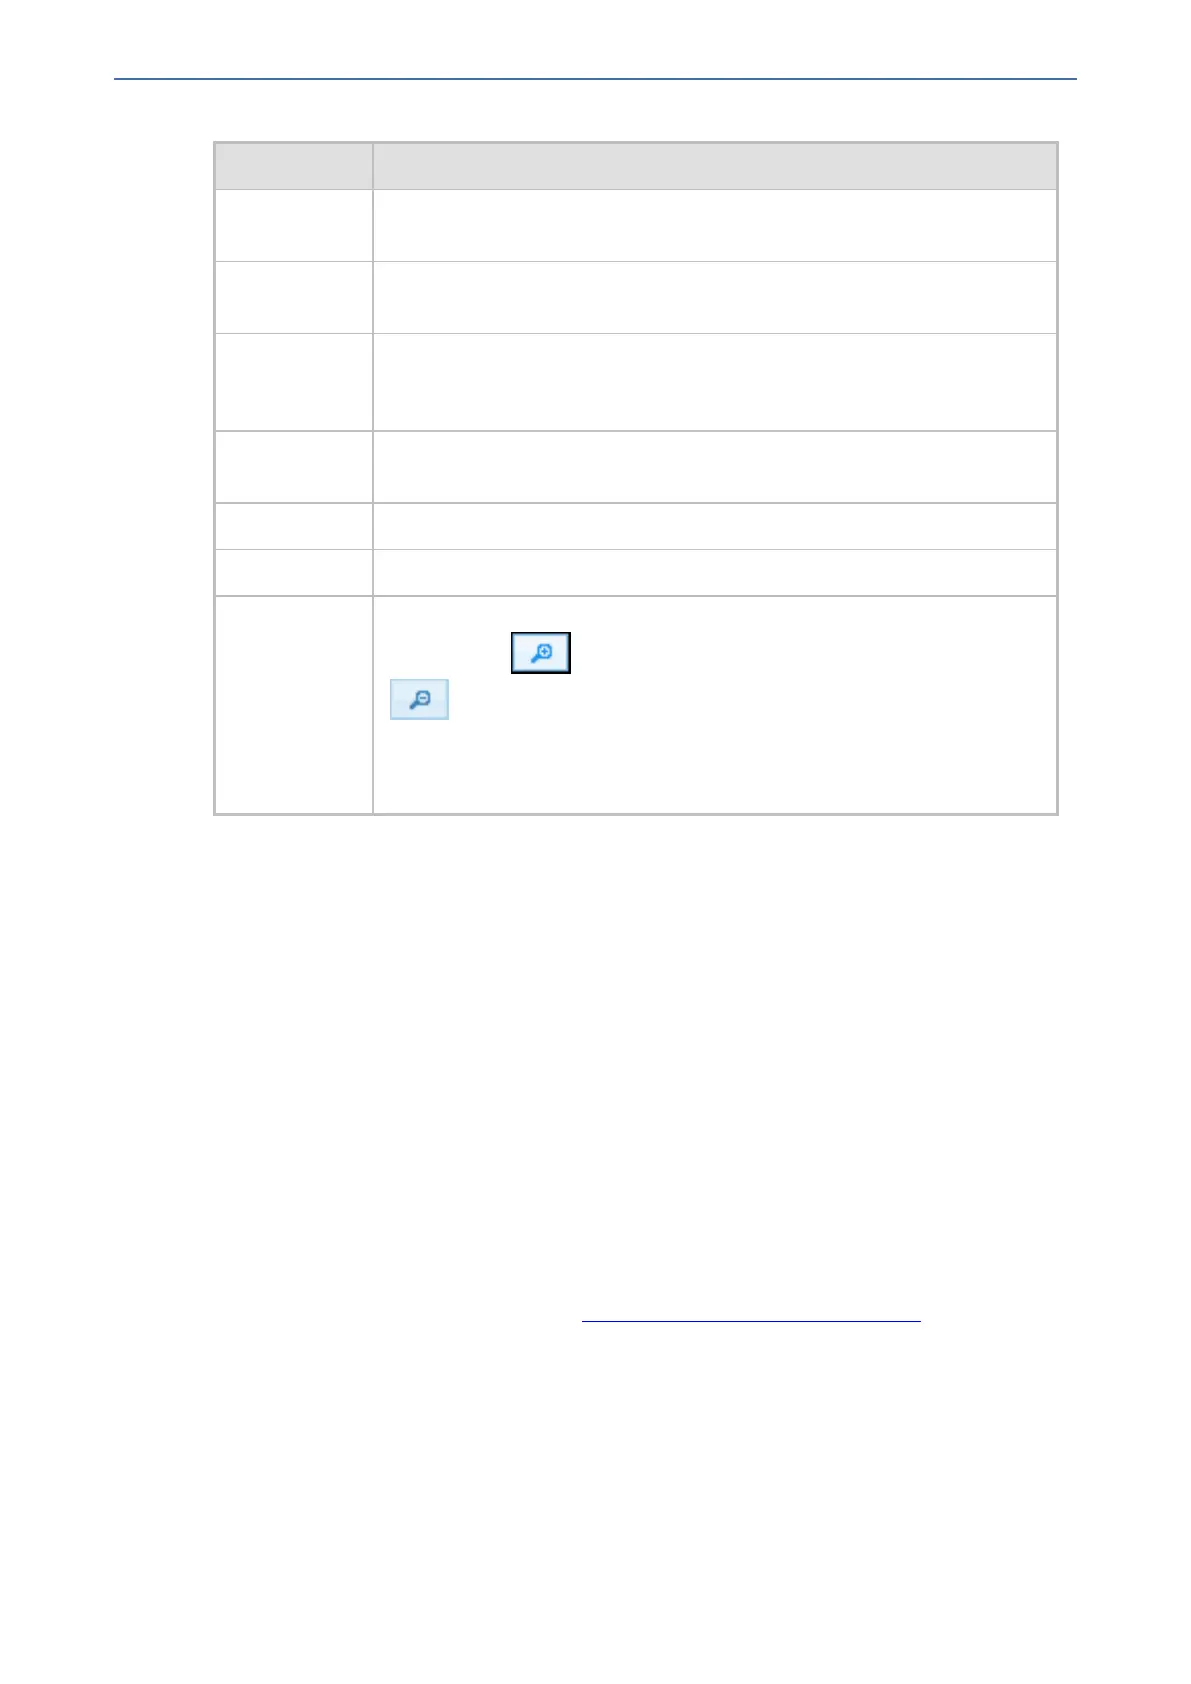
Button Description
The graph displays each trunk in a different color, according to the legend
shown in the top-left corner of the graph.
Remove
button
Removes the corresponding trunk from the graph.
Disable check
box
Hides or shows an already selected trunk. Select the check box to hide the
trunk display; clear the check box to show the trunk. This is useful if you do
not want to remove the trunk entirely (using the Remove button).
Get Most
Active button
Displays only the trunk with the most active channels (i.e., trunk with the
most calls).
Pause button Pauses the display in the graph.
Play button Resumes the display in the graph.
Zoom slide
ruler and
buttons
Increases or reduces the trunk utilization display resolution concerning time.
The Zoom In button increases the time resolution; the Zoom Out
button decreases it. Instead of using the buttons, you can use the
slide ruler. As you increase the resolution, more data is displayed on the
graph. The minimum resolution is about 30 seconds; the maximum resolution
is about an hour.
Configuring Performance Profiles
The Performance Profile table lets you configure up to 432 Performance Profile rules. A
Performance Profile rule defines thresholds of performance monitoring call metrics for Major and
Minor severity alarms. If the threshold is crossed, the device raises the corresponding severity
alarm. You can configure a Performance Profile rule for all calls (globally), or per SRD or IP Group.
You can configure the alarm thresholds for the following call metrics:
■ Answer Success Ratio or ASR (also known as Answer Seizure Ratio): The number (in
percentage) of answered calls (i.e. number of seizures resulting in an answer signal) out of the
total number of attempted calls (seizures). The metric is calculated for the outgoing call leg.
The metric includes the following SNMP performance monitoring MIBs:
● PM_gwSBCASR: ASR for all (global) entities (i.e., all IP Groups and SRDs)
● PM_gwSBCIPGroupASR: ASR per IP Group
● PM_gwSBCSRDASR: ASR per SRD
If the configured ASR minor or major thresholds are crossed, the device raises the SNMP
alarm, acASRThresholdAlarm (OID 1.3.6.1.4.1.5003.9.10.1.21.2.0.111).
To view ASR in the Web interface, see Viewing Call Success and Failure Ratio.
■ Network Effectiveness Ratio (NER): The number (in percentage) of successfully connected
calls out of the total number of attempted calls (seizures). The metric measures the ability of
the network to deliver a call to the called terminal. In addition to answered calls, the following
SIP response codes are regarded as successfully connected calls: 408 (Request Timeout),
480 (Temporarily Unavailable), and 486 (Busy Here). The metric is calculated for the outgoing
call leg. The metric includes the following SNMP performance monitoring MIBs:
● PM_gwSBCNER: NER for all (global) entities (i.e., all IP Groups and SRDs)
● PM_gwSBCIPGroupNER: NER per IP Group
- 940 -