CHAPTER53 Viewing Performance Monitoring
Mediant 1000 Gateway & E-SBC | User's Manual
● SUBSCRIBE: SUBSCRIBE
● Other: all SIP messages
If there is no data for the charts, the chart appears gray and "No Data" is displayed to the right of the
chart.
➢ To refresh the charts:
■ Click Refresh.
➢ To reset the counters:
■ Click Reset Counters.
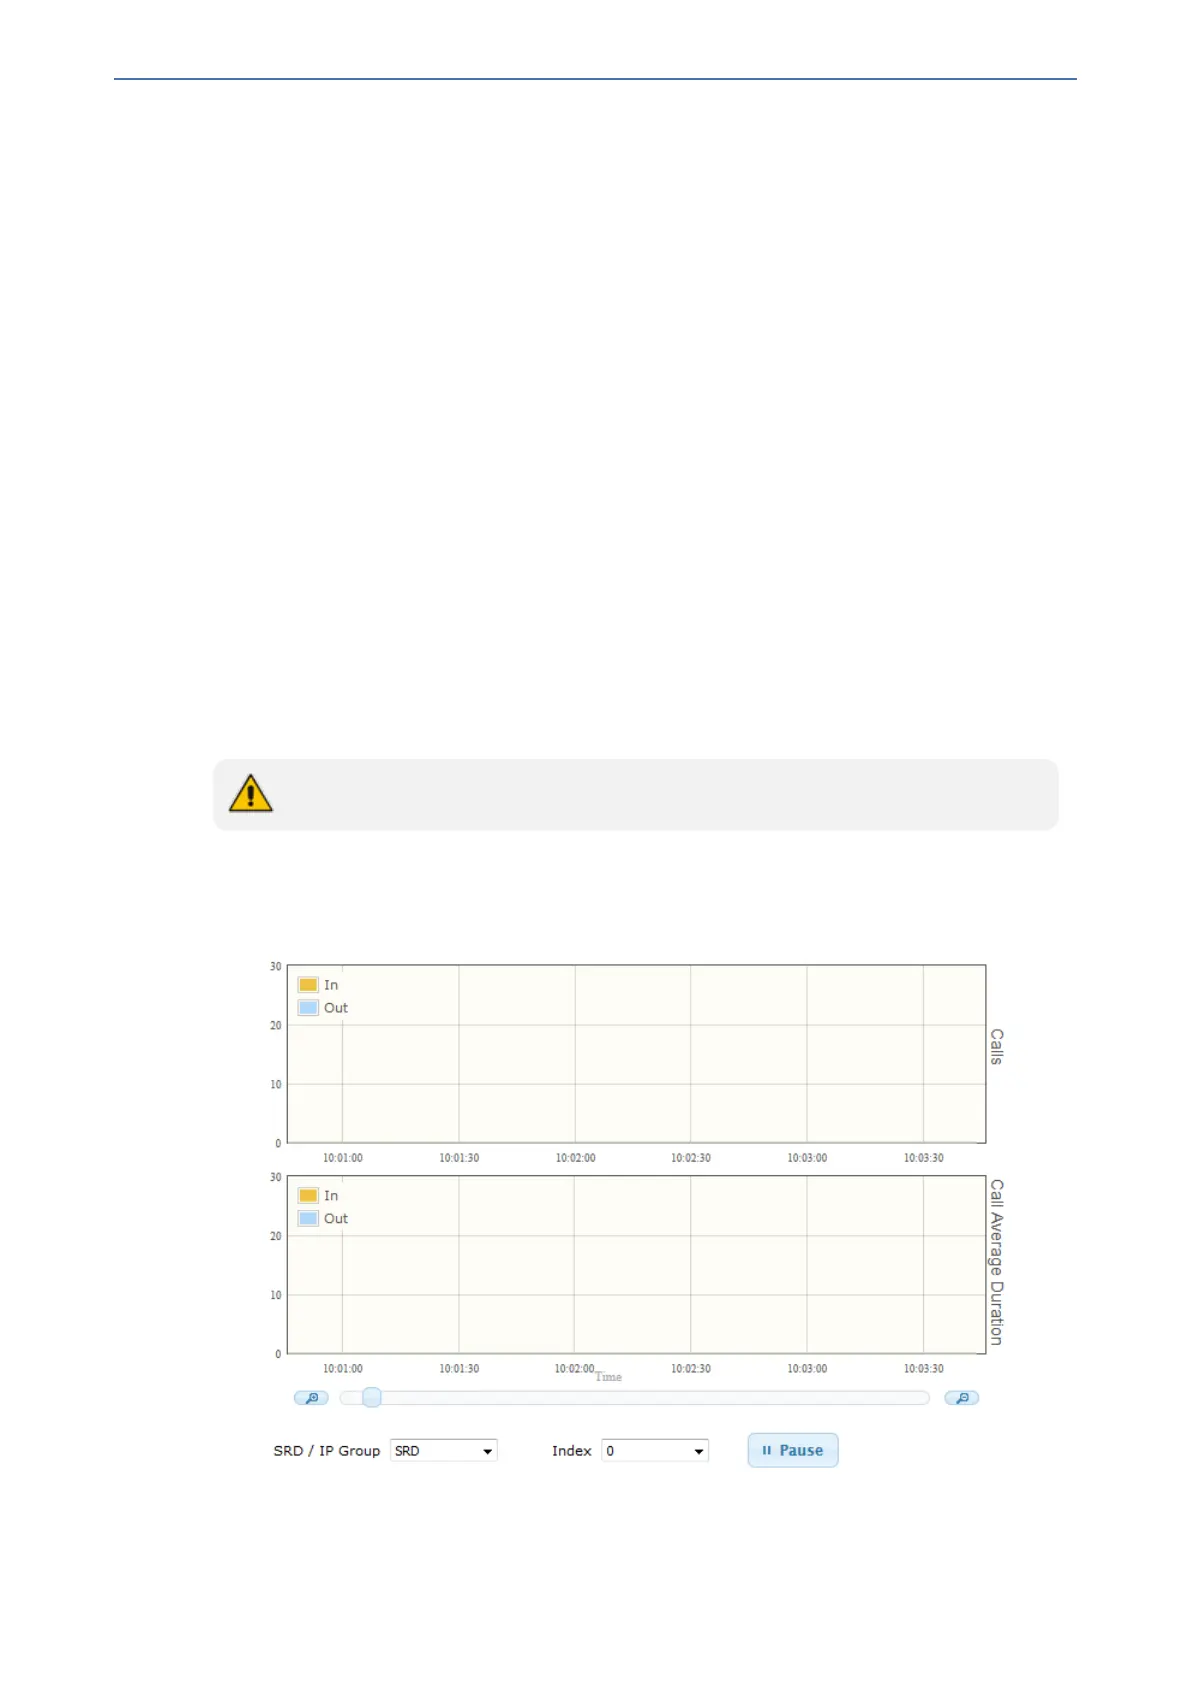
Viewing Average Call Duration
You can view the number of established calls over a 15-minute interval and the average call
duration (ACD) in the Web interface's Average Call Duration page. You can filter display by a
specific SRD or IP Group. The page displays the following two graphs:
■ Upper graph: Displays the number of established calls (INVITEs) in a 15-minute interval. The
x-axis indicates the time (hh:mm:ss) of the call and the y-axis the number of calls. The graph is
refreshed every 15 minutes.
■ Lower graph: Displays the ACD. The x-axis indicates the time (hh:mm:ss) and the y-axis the
average call duration. The ACD is refreshed every 15 minutes and therefore, this value reflects
the average duration of all established calls made within a 15-minute interval.
The Average Call Duration page is applicable only to SBC calls.
➢ To view number of active calls and average call duration:
1. Open the Average Call Duration page (Monitor menu > Monitor tab > Performance
Monitoring folder > Average Call Duration).
2. From the 'SRD / IP Group' drop-down list, select the configuration entity (SRD or IP Group).
3. From the 'Index' drop-down list, select the specific SRD or IP Group index.
- 938 -