Power Optimization for Mobile Usages 9
9-3
to accommodate demand and adapt power consumption. The interaction
between the OS power management policy and performance history is
described below:
1. Demand is high and the processor works at its highest possible
frequency (P0).
2. Demand decreases, which the OS recognizes after some delay; the
OS sets the processor to a lower frequency (P1).
3. The processor decreases frequency and processor utilization
increases to the most effective level, 80-90% of the highest possible
frequency. The same amount of work is performed at a lower
frequency.
4. Demand decreases and the OS sets the processor to the lowest
frequency, sometimes called Low Frequency Mode (LFM).
5. Demand increases and the OS restores the processor to the highest
frequency.
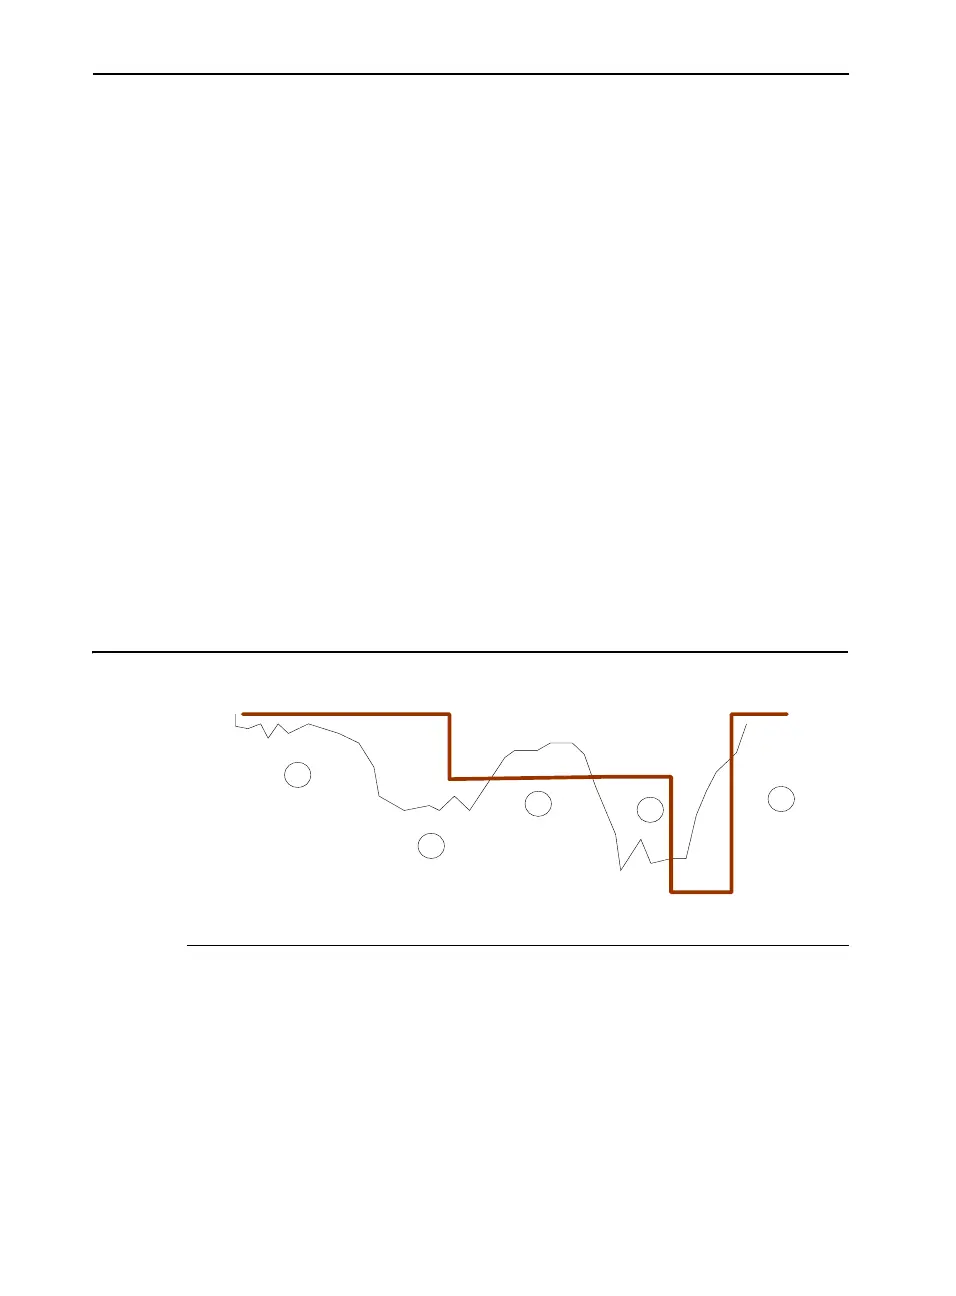
Figure 9-1 Performance History and State Transitions
CPU demand Frequency
& Power
1
2
3
4
5