WindO/I-NV4 User’s Manual 14-33
4 Using the Data
14
Data Log Function
4.1 Displaying the Data in the Line Chart
You can display the sampled data in the Line Chart.
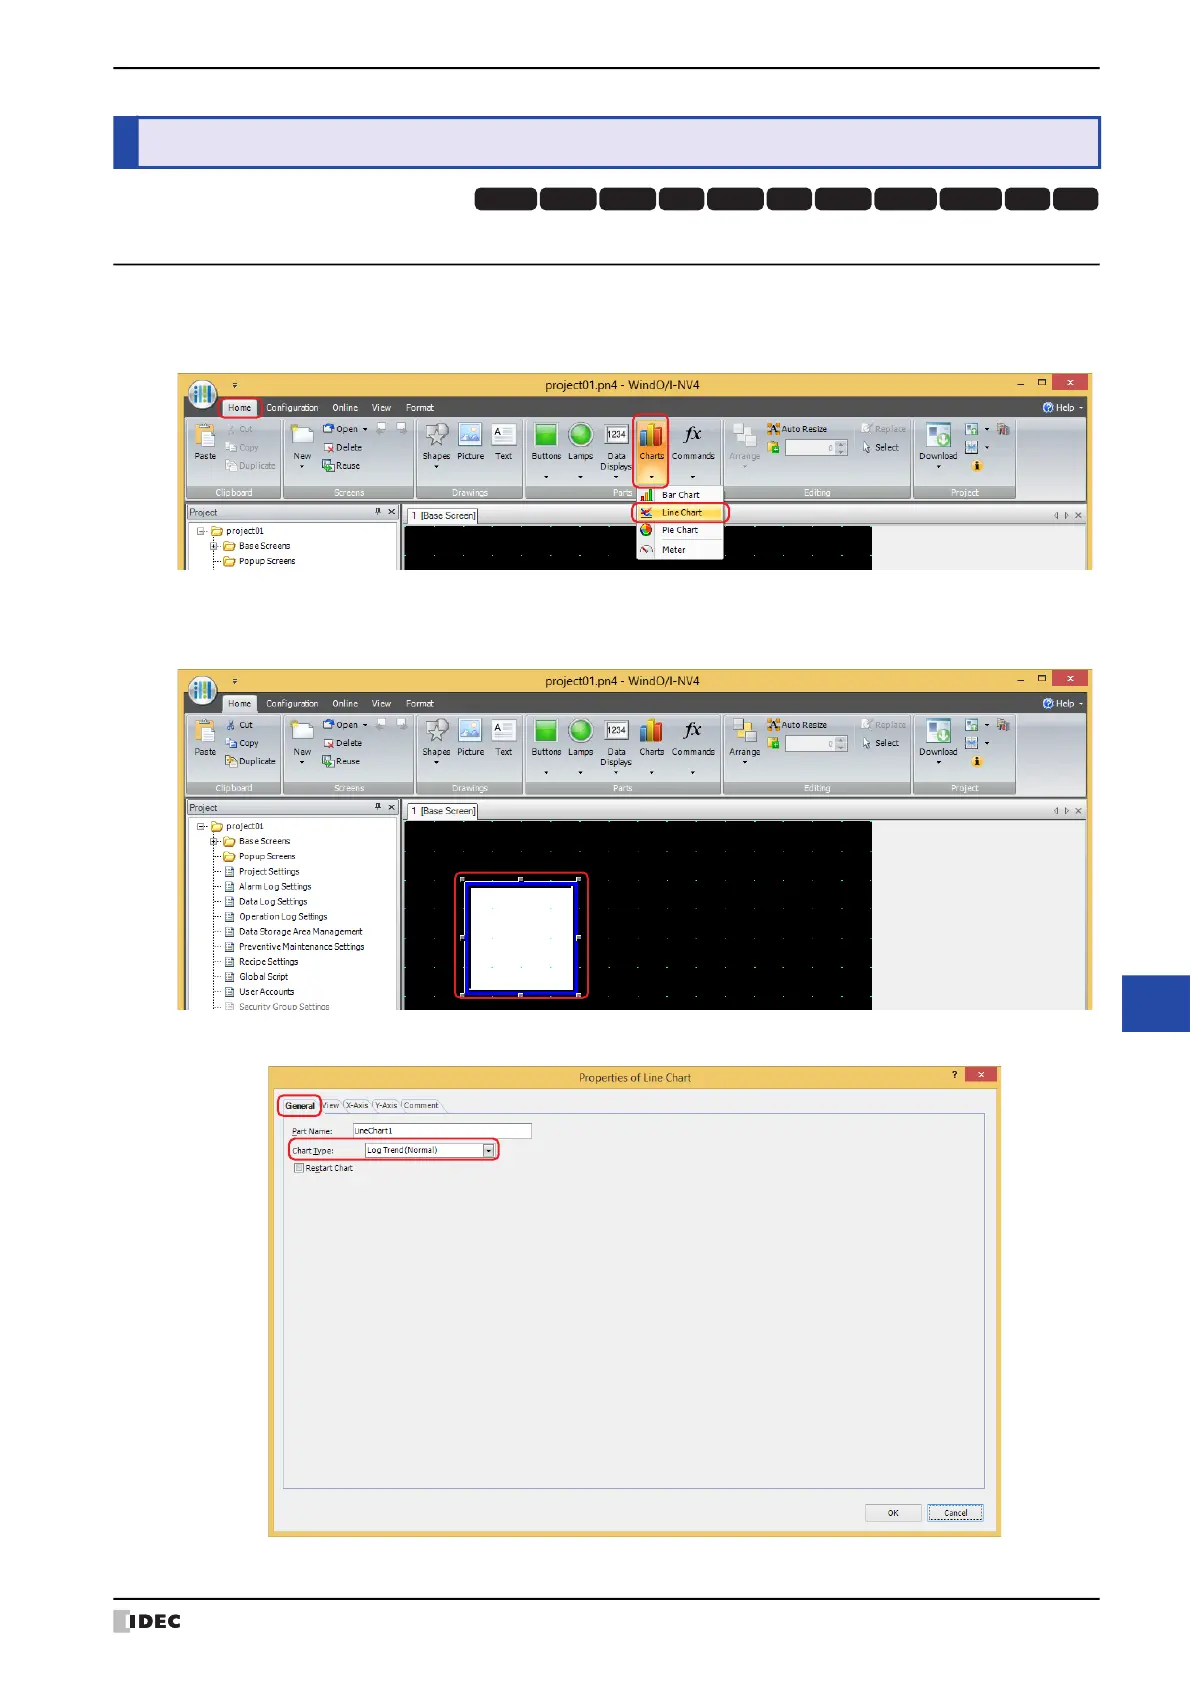
1 On the Home tab, in the Parts group, click Charts, and then click Line Chart.
2 Click a point on the edit screen where you wish to place the Line Chart.
3 Double-click the placed Line Chart and a Properties dialog box will be displayed.
4 On the General tab, select Chart Type as Log Trend (Normal) or Log Trend (Pen Recorder).
4 Using the Data
HG3G
HG2G-5FHG5G-V HG4G-V HG3G-V HG2G-V HG2G-5T
HG4G HG1G HG1P
HG2J-7U