2 Line Chart
11-24 WindO/I-NV4 User’s Manual
Example: Data Type under Data Format on the Y-Axis tab is "UBIN32(D)" and Reference Device Address
under Data is D100.
The display updates when the value of D100 changes from 0 to 1. The display is erased when the value
changes to 2. The display is first erased and then updated when the value changes to 3. The value of D100
is automatically changes to 0 after updating and clearing the display.
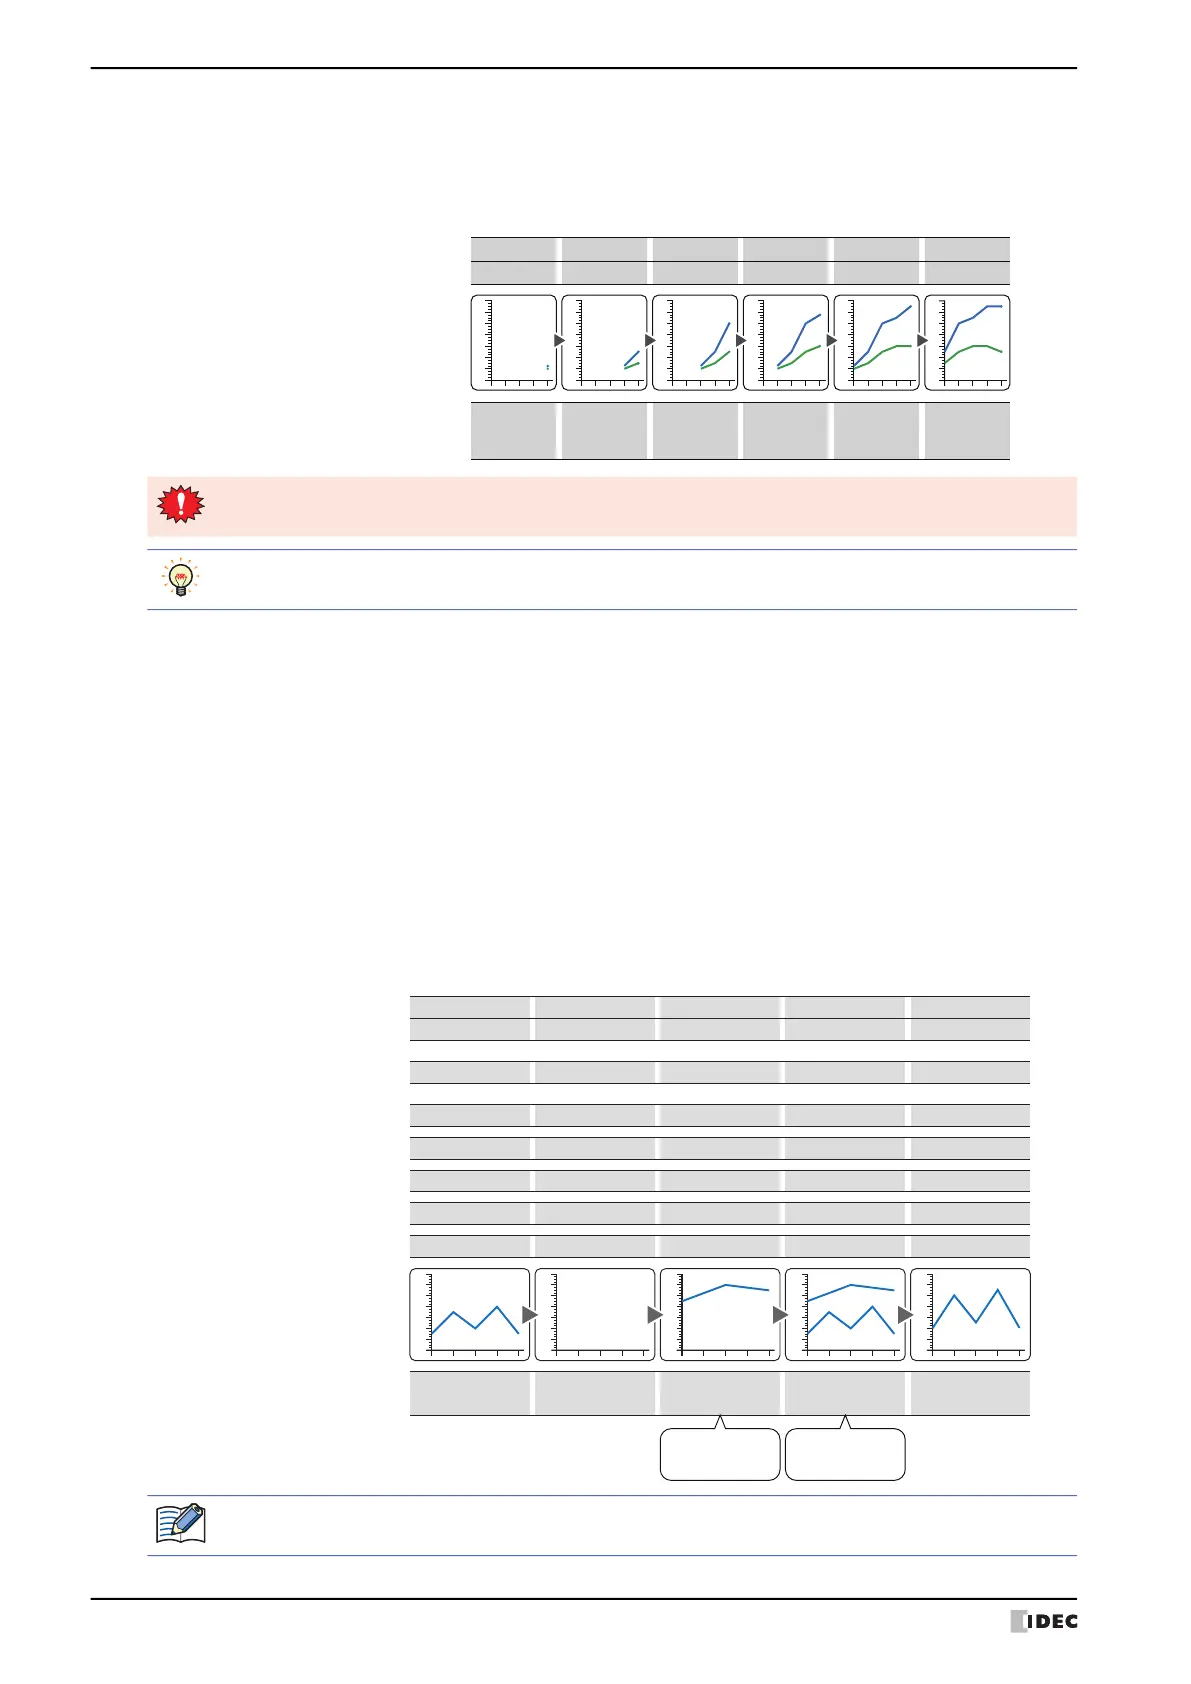
Log Trend (Pen Recorder): Shows values of device addresses sampled with the Data Log function in a trend chart.
The displayed chart is updated each time the latest data is sampled and the latest data is
always displayed at the right edge. The entire chart shifts to the left point by point and
the display is updated.
Example: Display Points on the X-Axis tab is 5:
Scroll,
display point 6
Display point 1 Display point 2 Display point 3 Display point 4 Display point 5
30
10
80
30
90
40
110
40
110
30
5
0
Ch1 data
Ch2 data
Display
Operaon
0
20
40
60
80
100
-20
120
0
20
40
60
80
100
-20
120
0
20
40
60
80
100
-20
120
0
20
40
60
80
100
-20
120
0
20
40
60
80
100
-20
120
0
20
40
60
80
100
-20
120
To display multiple items of data, set the sampling conditions and data size for the data to display to the
same settings. The data cannot be displayed if its sampling conditions or data size is different.
The chart can display a maximum of 20 lines.
Device Address Display: Display the values of multiple, continuous device addresses as a single line chart.
Updating and erasing the display is controlled by the lower 2 bits of the start address
number value (control status). The value of the starting address number is automatically
changes to 0 after updating and clearing the display.
The number of values of device addresses to display is specified by the value of start
address number + 1.
The values of device addresses from start address number + 2 are displayed on the chart.
The data size of the start address number and the start address number + 1 is 16 bits,
and that of the start address number + 2 and later varies based on the data type selected
with Data Format on the Y-Axis tab. For details on data types, refer to Chapter 2 “1.1
Available Data” on page 2-1.
20
80
70
100
10
50
30
90
90
110
20
60
20
0→10
80
00→1
10
0
55355
0→10→10→100→1
10
50
20
60
10
10
50
20
60
10
0
20
40
60
80
100
-20
120
0
20
40
60
80
100
-20
120
0
20
40
60
80
100
-20
120
0
20
40
60
80
100
-20
120
0
20
40
60
80
100
-20
120
(Start address number +2) D102 value
The first plotted point
(Start address number +4) D103 value
The second plotted point
(Start address number +6) D104 value
The third plotted point
(Start address number +8) D105 value
The forth plotted point
(Start address number +10) D106 value
The fifth plotted point
(Start address number +1) D101 value
Number of device addresses to display values
D100-1 value Erase
(Start address number) D100-0 value Update
Update
Erase
Update
Do not erase
Update
Do not erase
Update
Erase
Update
Do not erase
Number of display
points changed
Number of display
points changed
Operation
Display
If there are many items of data to display, it may take some time to update the display.
 Loading...