2 Line Chart
11-30 WindO/I-NV4 User’s Manual
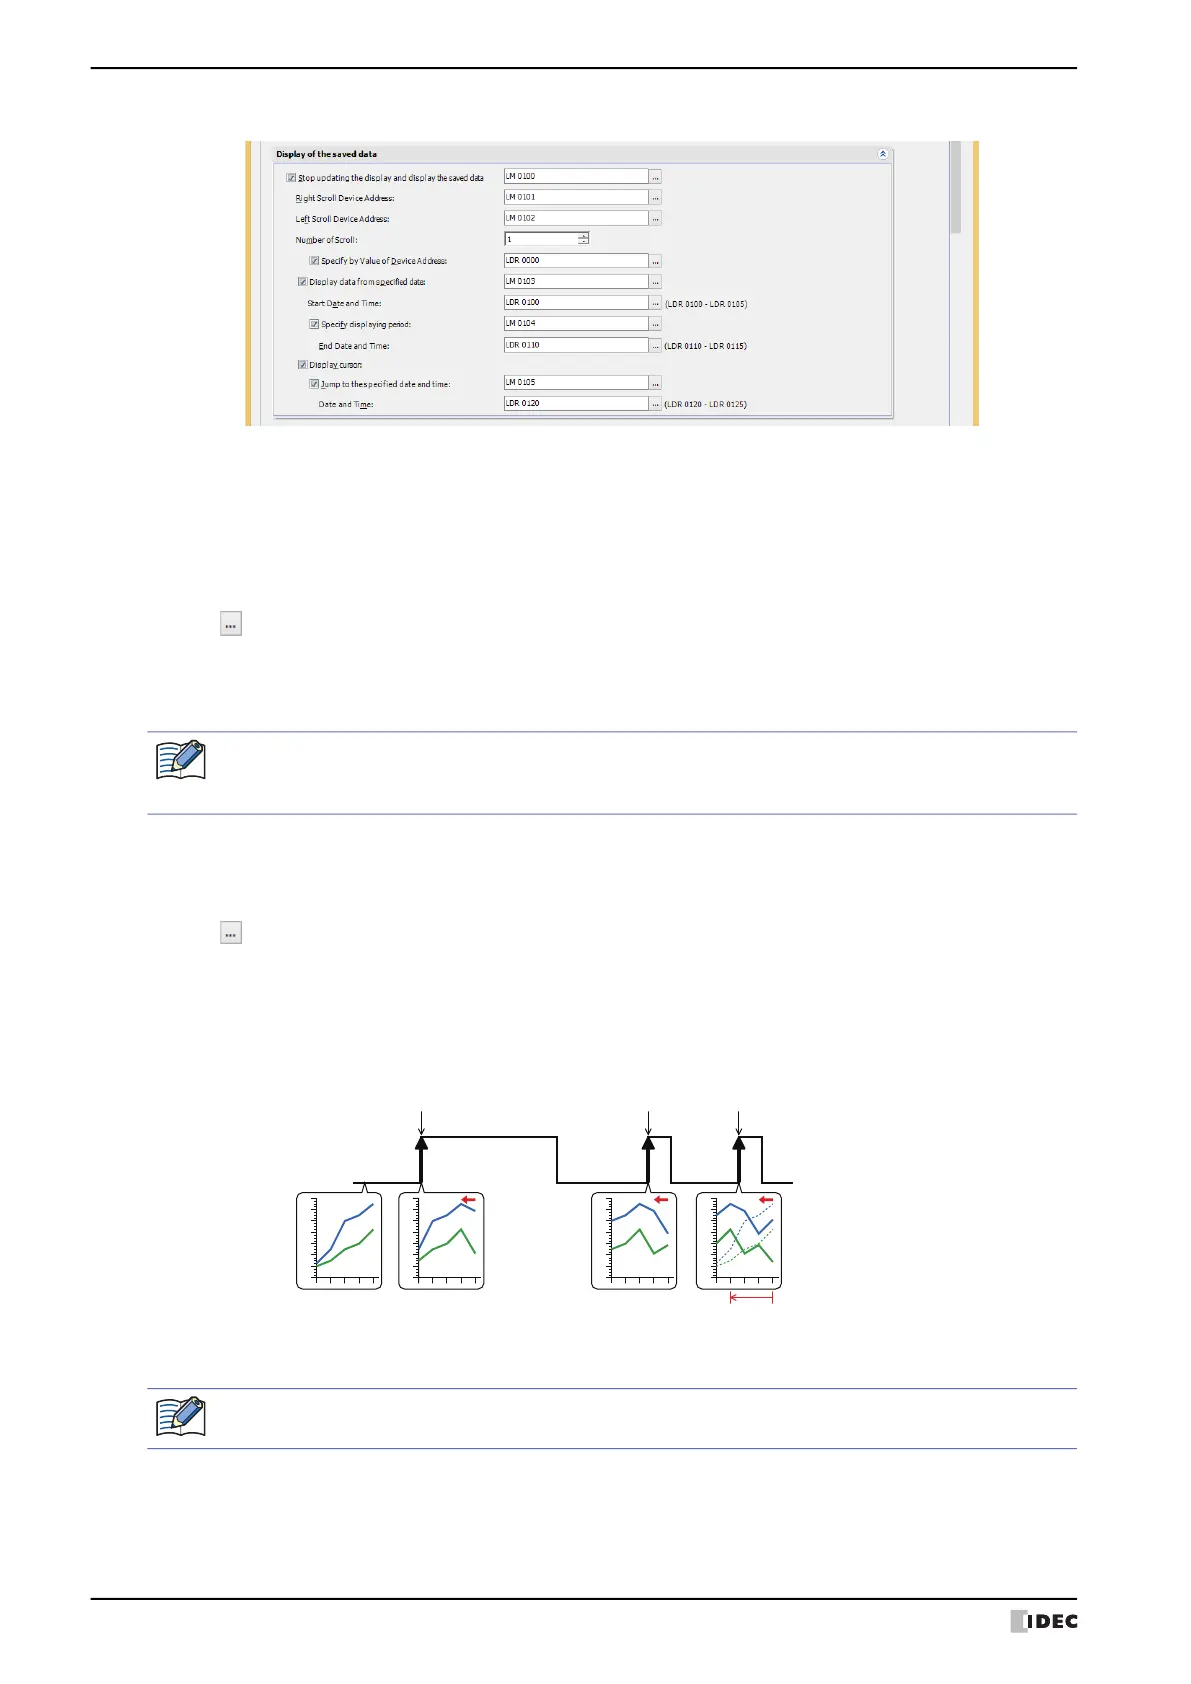
■ Display of the saved data
This option can only be configured when Log Trend (Normal) or Log Trend (Pen Recorder) is selected from
Chart Type on the General tab.
Stop updating the display and display the saved data:
To scroll the chart to display past data and to display the cursor, the chart display updating must be stopped. To
control updating the display, select this check box and specify the bit device or the bit number of the word device
to control the display.
Click to display the Tag Editor. For the device address configuration procedure, refer to Chapter 2 “5.1 Device
Address Settings” on page 2-70.
Display updating stops when the value of device address changes from 0 to 1. Display updating restarts when the
value of device address changes from 1 to 0.
When displaying a line graph using a file (.BIN) saved in external memory, the data on a channel that does
not have a BIN file will not be displayed. For details about the BIN file, refer to Chapter 14 “Save Data Log
Data and Display in Line Chart or Data Log Display” on page 14-23.
Right Scroll Device Address, Left Scroll Device Address:
The chart can be scrolled to the right or to the left when display updating is stopped. This option specifies the bit
device or the bit number of the word device to scroll the chart left or right.
Click to display the Tag Editor. For the device address configuration procedure, refer to Chapter 2 “5.1 Device
Address Settings” on page 2-70.
The chart scrolls right or left one point of data each time the value of device address changes from 0 to 1.
These options can only be configured when the Stop updating the display and display the saved data check
box is selected.
1
0
Right scroll device address
LM0 value
0
20
40
60
80
100
-20
120
0
20
40
60
80
100
-20
120
0
20
40
60
80
100
-20
120
0
20
40
60
80
100
-20
120
Scroll right
1 data point
Stop updating
Scroll right
1 data point
Scroll right
1 data point
Stop updating,
then scroll right
3 data points
When the value of Display Points is larger than the number of dots on the X-axis (the horizontal size of
the area displaying the graph), scroll the chart by the number of dots specified in Number of Scroll.
 Loading...