1 Bar Chart
11-12 WindO/I-NV4 User’s Manual
■ Show Gridline
Select this check box to display grid lines on the chart. Grid lines are displayed above the chart. Can only be set when
the Show Ticks check box is selected.
*2 HG5G/4G/3G/2G-V, HG4G/3G, HG2G-5F/-5T, HG1G/1P only
Magnification
*2
:
W, H: Selects magnification (0.5, 1 to 8) for the displayed text.
Can only be set when Standard is selected for Font.
Color:
Selects the color of displayed text (color: 256 colors, monochrome: 16 shades).
Click Color to display the Color Palette. Select a color from the Color Palette.
If the area for displaying the scale is small, the scale will not be displayed properly.
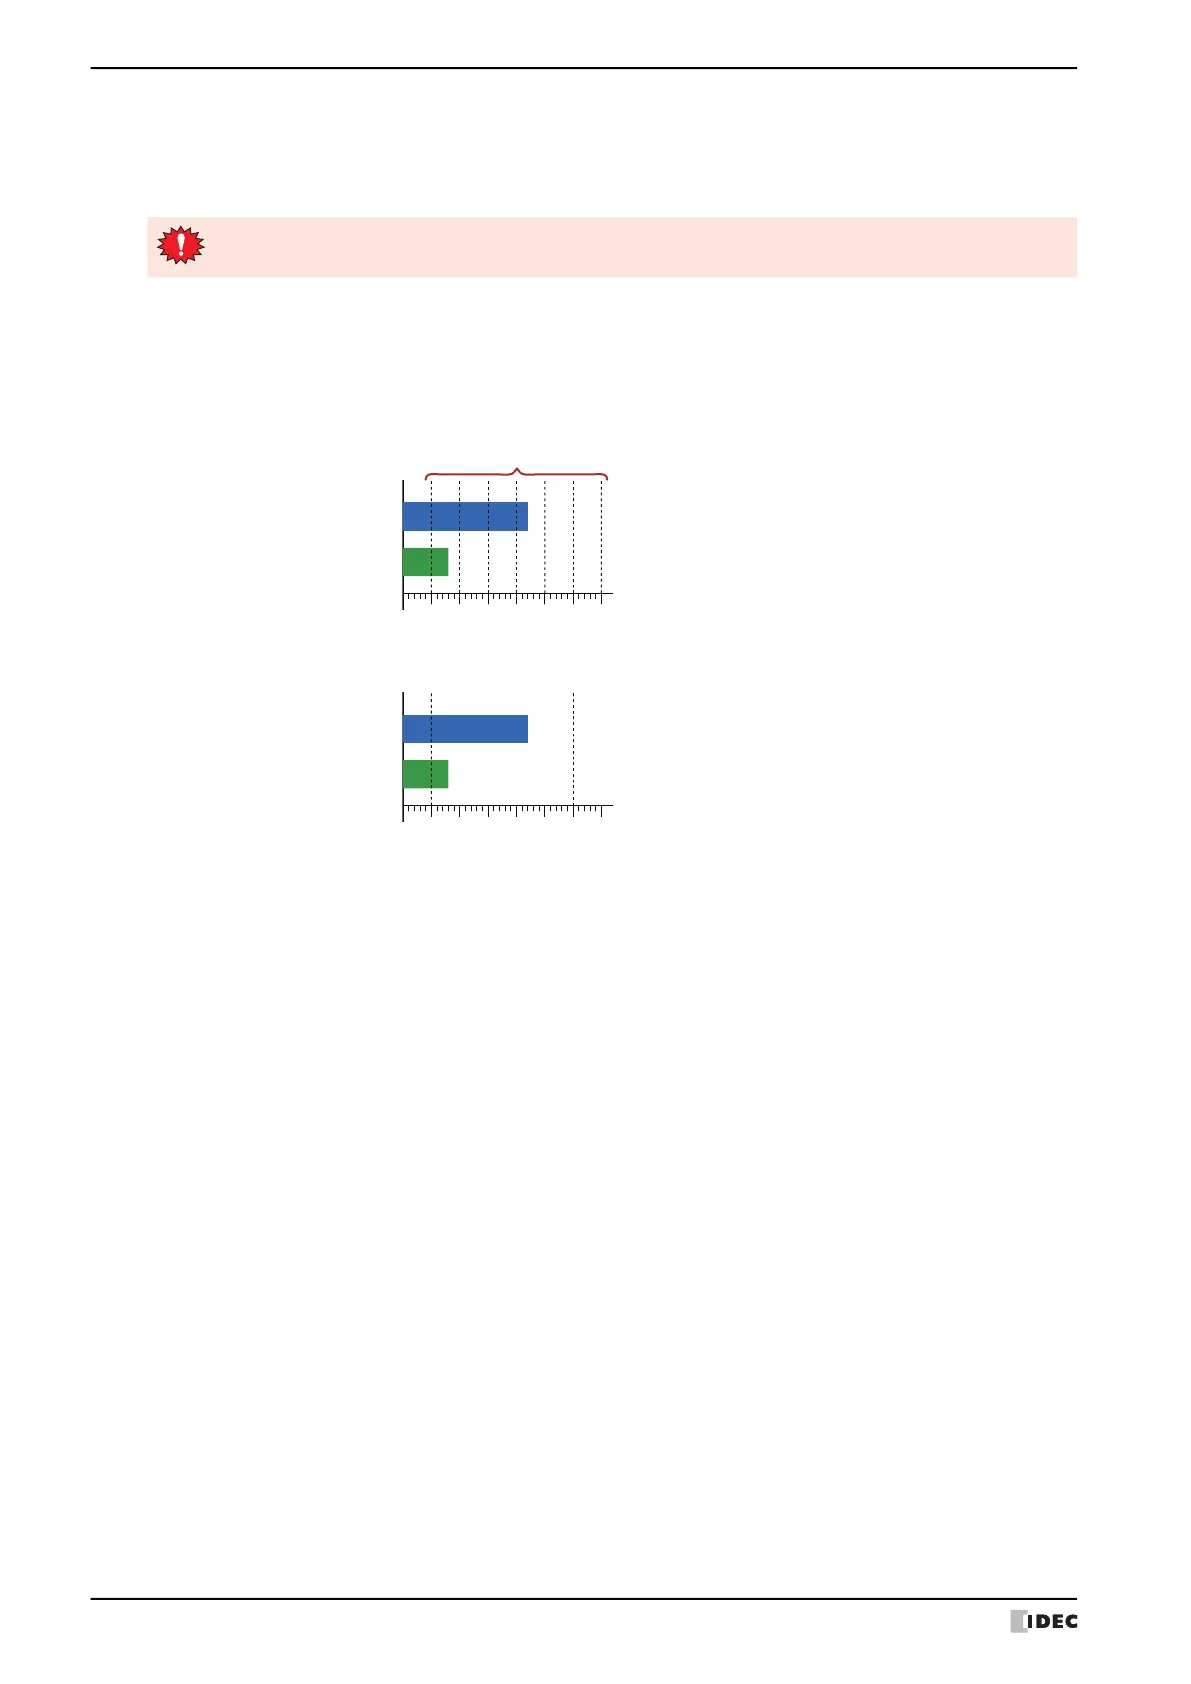
Display Position: Select from Scale and Data Over to specify the grid line display position.
Scale: Grid lines are displayed according to the number of major scale divisions.
Data Over: Grid lines are displayed at the positions of values specified for Maximum and
Minimum under the Data Over tab.
Line Type: Selects the type of grid lines from the following.
Solid, Dot, Dash, Long Dash, Long Dash Dot, Long Dash Dot Dot
Color: Specifies grid line color (color: 256 colors, monochrome: 16 shades).
Click Color to display the Color Palette. Select a color from the Color Palette.
Grid line

 Loading...