iView - Controller View
9-12 Manual # 42-02-7223
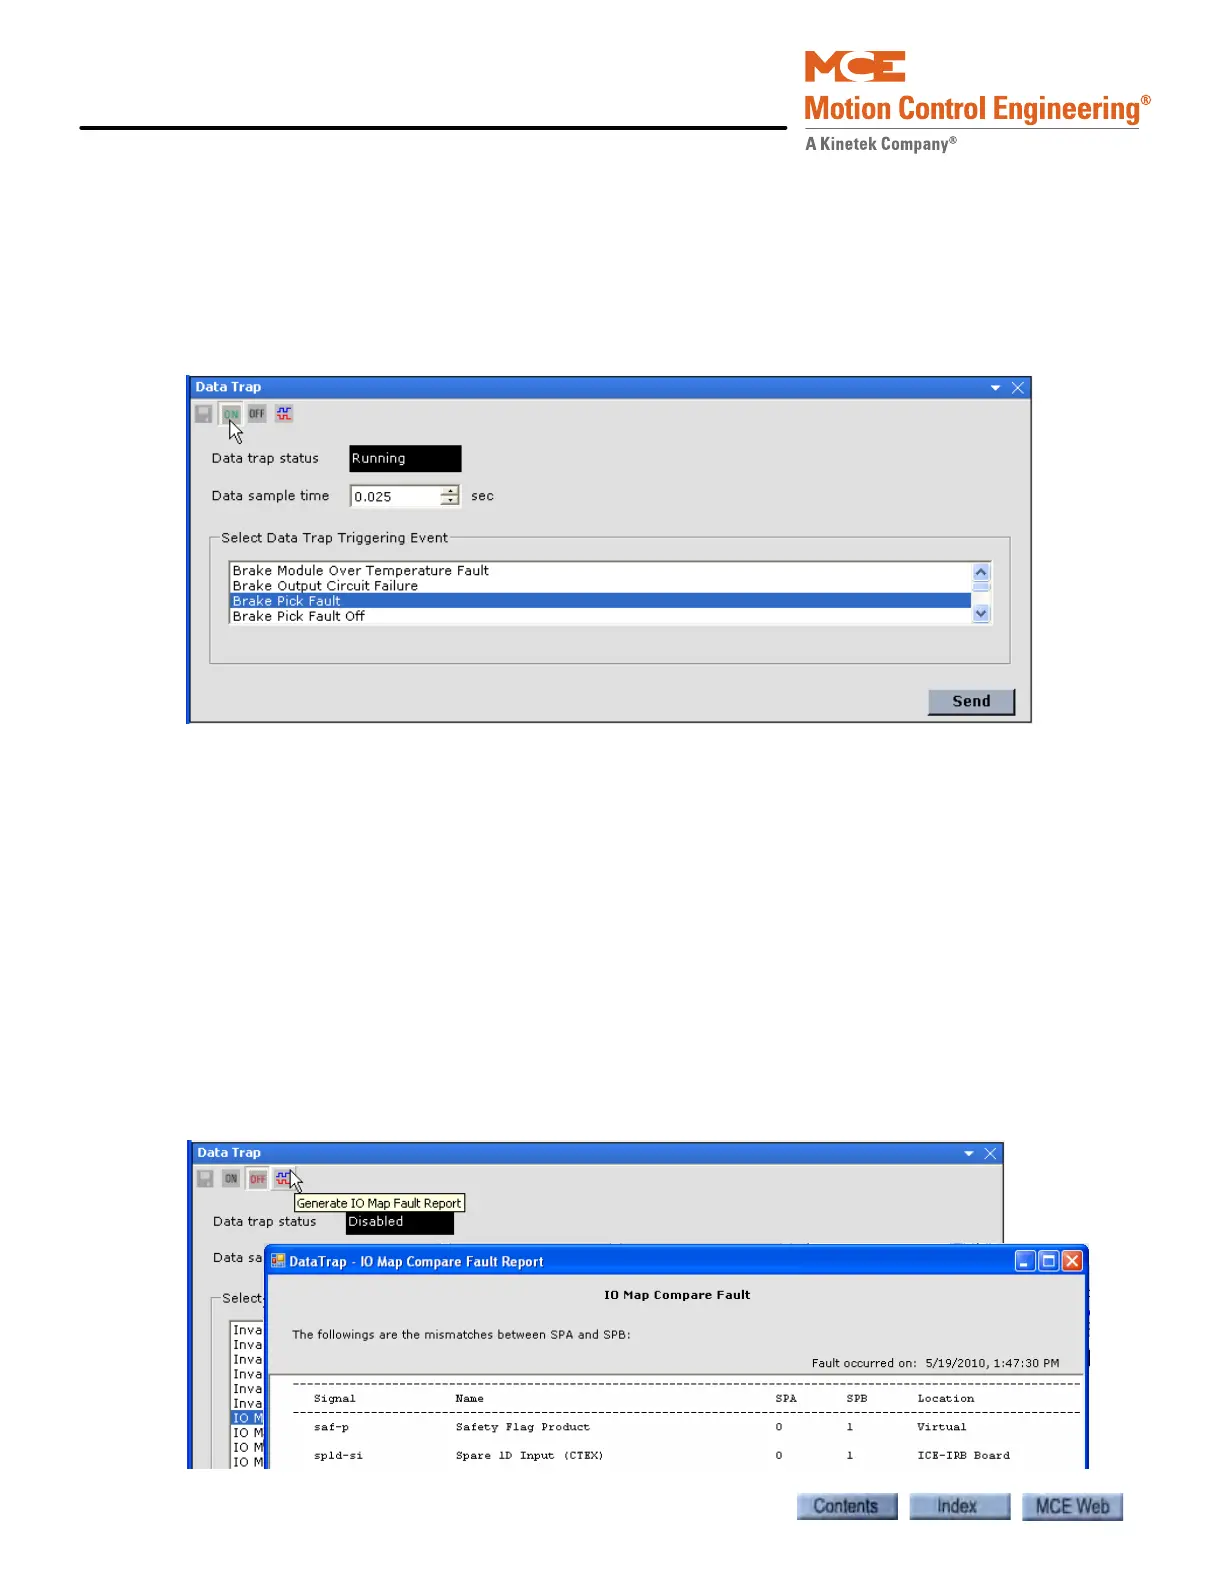
Diagnostics - Data Trap
The data trap diagnostic tool allows you to record and analyze controller data including input
and output states, internal flags and parameter values. When the trap is ON (Running), the con-
troller samples data at specified intervals (Data sample time). The most recent 500 samples are
retained in a buffer. The user selects a specific event to “trigger” the data trap. When the
selected event occurs, sampling stops and the data in the buffer can be saved to disk and then
viewed. The data leading up to the event can be examined to help diagnose controller problems.
• ON/OFF buttons: Click the ON button to turn the data trap ON. The Data trap status
changes to Running. Click the OFF button to turn the data trap OFF. The Data trap status
changes to Disabled.
• Data trap status: Indicates the status of the data trap, Disabled or Running.
• Data sample time: Sets the duration of the data sample.
• Select Data Trap Triggering Event: Select from the list of signals and events and then Send
to the controller.
• Save button: Once the data trap has been triggered, the Data trap status changes to Dis-
abled (OFF) and no further samples are taken. Click the Save icon to display the Save dia-
log box. Choose a name and a location for the file and click Save. The saved files (.csv) can
be viewed using a spreadsheet program such as Microsoft Excel.
• Generate IO Map Fault Report button: Additional information about an IO Map Compare
Fault or IO Map Toggle Compare Fault can be obtained by clicking this button after the
fault has occurred but before the fault has been reset.