System Performance
10-87
10
iControl DC
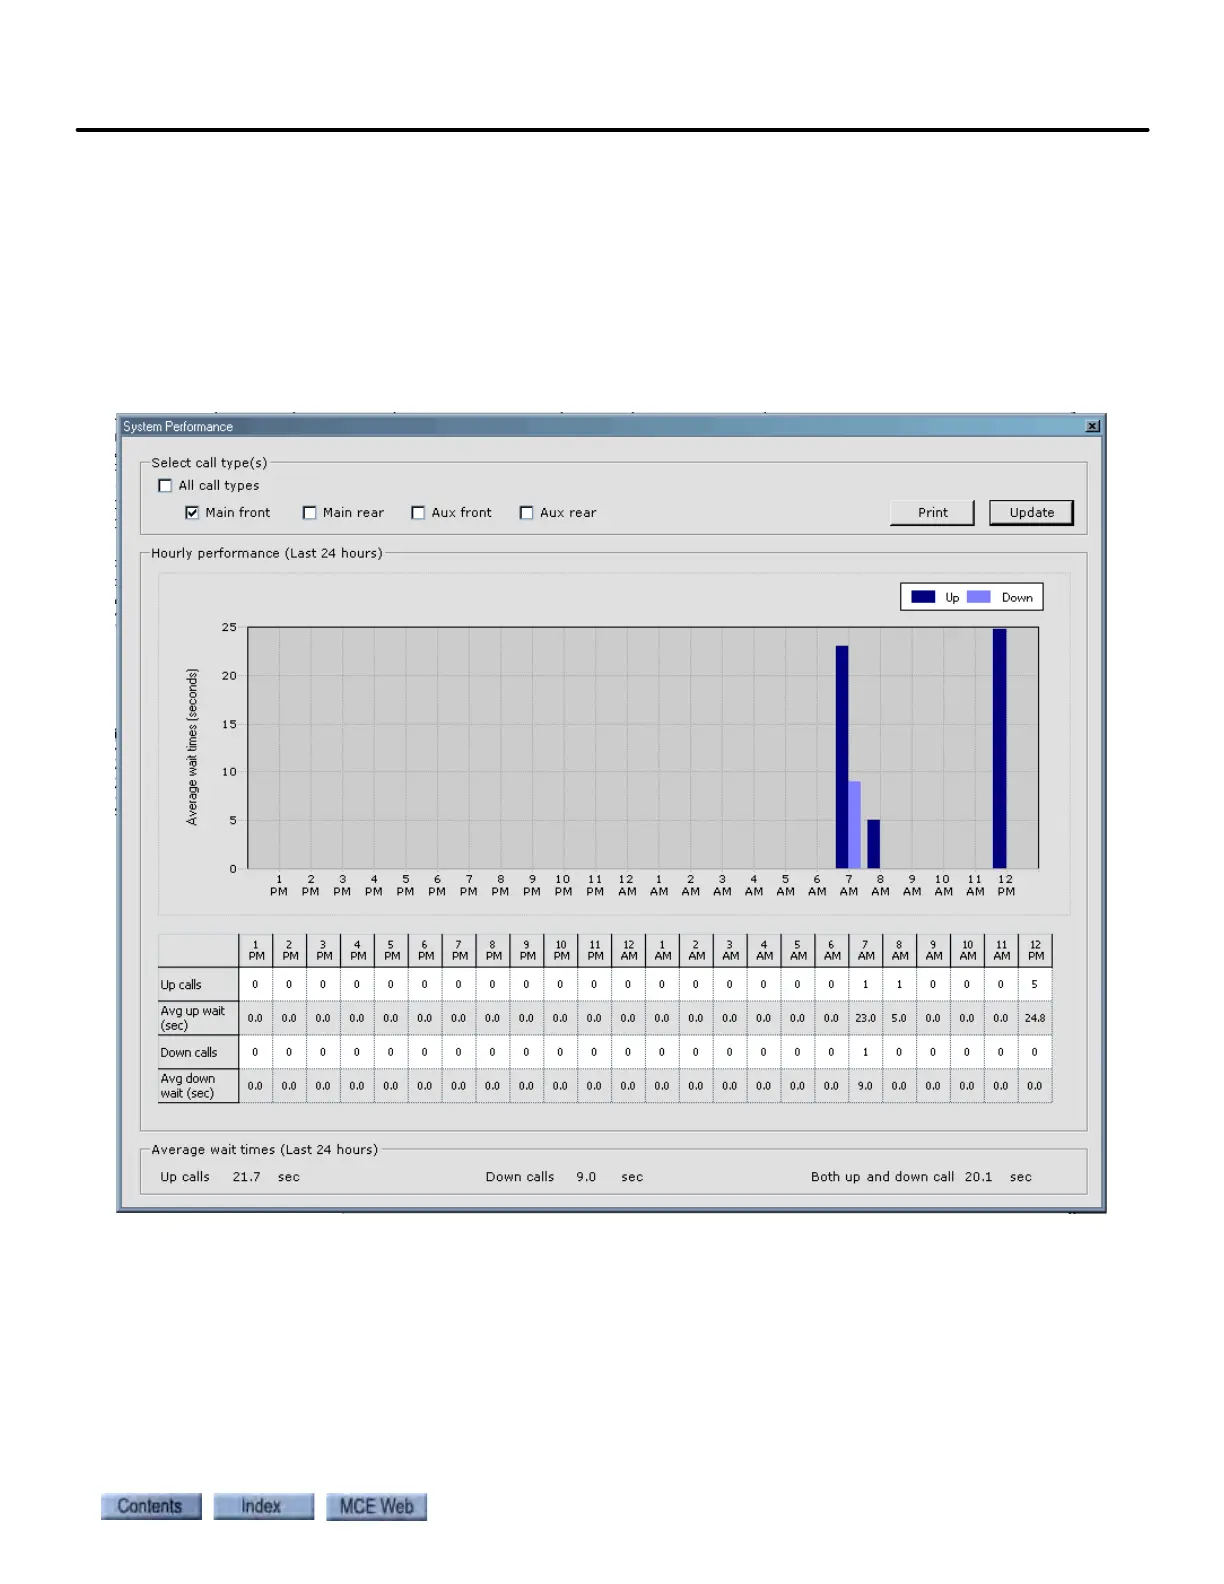
System Performance
This frame captures and graphs elevator performance over the most recent 24-hour period,
including:
• Graphical representation of hourly average wait times for up and down hall calls
• Number of up and down hall calls answered each hour
• Average wait time for up and down hall calls for each hour
• Average wait time for up, down, and all hall calls during the last 24 hours
Information may be printed by clicking on the print button.